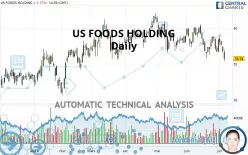
US FOODS HOLDING - Daily - Technical analysis published on 07/07/2021 (GMT)
- 250
- 0
Click here for a new analysis!
- Timeframe : Daily
- - Analysis generated on
- Status : INVALID

Summary of the analysis

Additional analysis
Quotes
The US FOODS HOLDING rating is 35.74 USD. The price is lower by -2.78% since the last closing and was traded between 35.41 USD and 37.01 USD over the period. The price is currently at +0.93% from its lowest and -3.43% from its highest.A study of price movements over other periods shows the following variations:
Technical
A technical analysis in Daily of this US FOODS HOLDING chart shows a sharp bearish trend. 82.14% of the signals given by moving averages are bearish. This strongly bearish trend is supported by the strong bearish signals given by short-term moving averages. An assessment of moving averages reveals a bearish signal that could impact this trend:
Bearish trend reversal : adaptative moving average 100
Type : Bearish
Timeframe : Daily
An assessment of technical indicators shows a bearish signal.
Central Indicators, the detector scanner for these technical indicators has recently detected several signals:
Pivot points : price is under support 3
Type : Neutral
Timeframe : Daily
MACD crosses DOWN its Moving Average
Type : Bearish
Timeframe : Daily
Price is back under the pivot point
Type : Bearish
Timeframe : Weekly
Williams %R indicator is back under -50
Type : Bearish
Timeframe : Daily
Central Patterns, the scanner specializing in chart patterns, did not identify any signals.
Central Candlesticks, the scanner specialised in Japanese candlesticks, detects a bearish signal that could support the hypothesis of a small drop in the very short term:
Downside gap
Type : Bearish
Timeframe : Daily
| S3 | S2 | S1 | Price | R1 | R2 | R3 | |
|---|---|---|---|---|---|---|---|
| ProTrendLines | 25.23 | 28.02 | 31.02 | 35.74 | 36.92 | 38.67 | 40.59 |
| Change (%) | -29.41% | -21.60% | -13.21% | - | +3.30% | +8.20% | +13.57% |
| Change | -10.51 | -7.72 | -4.72 | - | +1.18 | +2.93 | +4.85 |
| Level | Minor | Intermediate | Intermediate | - | Major | Intermediate | Major |
To determine price objectives, it is also possible to use the pivot points. Here is the price position in relation to pivot points:
| Pivot points | S3 | S2 | S1 | PP | R1 | R2 | R3 |
|---|---|---|---|---|---|---|---|
| Standard | 35.50 | 36.05 | 36.41 | 36.96 | 37.32 | 37.87 | 38.23 |
| Camarilla | 36.51 | 36.59 | 36.68 | 36.76 | 36.84 | 36.93 | 37.01 |
| Woodie | 35.40 | 36.00 | 36.31 | 36.91 | 37.22 | 37.82 | 38.13 |
| Fibonacci | 36.05 | 36.40 | 36.62 | 36.96 | 37.31 | 37.53 | 37.87 |
| Pivot points | S3 | S2 | S1 | PP | R1 | R2 | R3 |
|---|---|---|---|---|---|---|---|
| Standard | 34.18 | 35.38 | 36.53 | 37.73 | 38.88 | 40.08 | 41.23 |
| Camarilla | 37.02 | 37.24 | 37.46 | 37.67 | 37.89 | 38.10 | 38.32 |
| Woodie | 34.15 | 35.37 | 36.50 | 37.72 | 38.85 | 40.07 | 41.20 |
| Fibonacci | 35.38 | 36.28 | 36.84 | 37.73 | 38.63 | 39.19 | 40.08 |
| Pivot points | S3 | S2 | S1 | PP | R1 | R2 | R3 |
|---|---|---|---|---|---|---|---|
| Standard | 31.18 | 33.47 | 35.92 | 38.21 | 40.66 | 42.95 | 45.40 |
| Camarilla | 37.06 | 37.49 | 37.93 | 38.36 | 38.80 | 39.23 | 39.66 |
| Woodie | 31.25 | 33.51 | 35.99 | 38.25 | 40.73 | 42.99 | 45.47 |
| Fibonacci | 33.47 | 35.28 | 36.40 | 38.21 | 40.02 | 41.14 | 42.95 |
Numerical data
The following is the status of technical indicators and moving averages registered at the time this technical analysis was created:
| RSI (14): | 38.27 | |
| MACD (12,26,9): | -0.4600 | |
| Directional Movement: | -11.43 | |
| AROON (14): | -21.43 | |
| DEMA (21): | 37.12 | |
| Parabolic SAR (0,02-0,02-0,2): | 38.94 | |
| Elder Ray (13): | -1.19 | |
| Super Trend (3,10): | 39.54 | |
| Zig ZAG (10): | 35.48 | |
| VORTEX (21): | 0.8900 | |
| Stochastique (14,3,5): | 30.03 | |
| TEMA (21): | 37.07 | |
| Williams %R (14): | -75.71 | |
| Chande Momentum Oscillator (20): | -0.02 | |
| Repulse (5,40,3): | -3.2200 | |
| ROCnROLL: | 2 | |
| TRIX (15,9): | -0.1200 | |
| Courbe Coppock: | 5.14 |
| MA7: | 37.25 | |
| MA20: | 37.89 | |
| MA50: | 38.63 | |
| MA100: | 38.31 | |
| MAexp7: | 37.17 | |
| MAexp20: | 37.72 | |
| MAexp50: | 38.11 | |
| MAexp100: | 37.30 | |
| Price / MA7: | -4.05% | |
| Price / MA20: | -5.67% | |
| Price / MA50: | -7.48% | |
| Price / MA100: | -6.71% | |
| Price / MAexp7: | -3.85% | |
| Price / MAexp20: | -5.25% | |
| Price / MAexp50: | -6.22% | |
| Price / MAexp100: | -4.18% |
News
Don't forget to follow the news on US FOODS HOLDING. At the time of publication of this analysis, the latest news was as follows:
- US Foods Announces New Chief Information and Digital Officer
- US Foods Solves Operators’ Steak Challenges with Tender by Design™ Process
- US Foods Summer Scoop Lineup Takes Aim at Restaurant Labor Shortage
- US Foods to Participate in the Jefferies Virtual Consumer Conference on June 22, 2021
- Eighteen US Foods Drivers Inducted Into the International Foodservice Distributors Association Truck Driver Hall of Fame
About author

Online


Add a comment
Comments
0 comments on the analysis US FOODS HOLDING - Daily