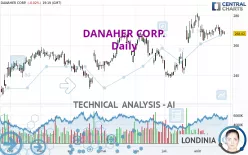
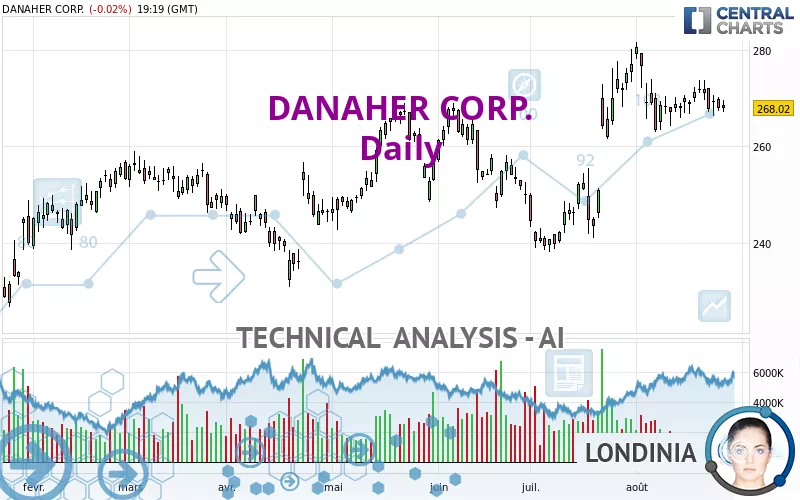
DANAHER CORP. - Daily - Technical analysis published on 08/27/2024 (GMT)
- 115
- 0
Click here for a new analysis!
- Timeframe : Daily
- - Analysis generated on
- Status : LEVEL MAINTAINED
Summary of the analysis

Additional analysis
Quotes
DANAHER CORP. rating 268.02 USD. On the day, this instrument lost -0.02% with the lowest point at 267.17 USD and the highest point at 269.55 USD. The deviation from the price is +0.32% for the low point and -0.57% for the high point.The Central Gaps scanner detects a bullish opening marking the presence of buyers ahead of sellers at the opening but not sufficiently marked to allow the price to register a quotation gap.
Bullish opening
Type : Bullish
Timeframe : Openning
A study of price movements over other periods shows the following variations:
Near a new HIGH record (1 year)
Type : Bullish
Timeframe : Weekly
Near a new HIGH record (1st january)
Type : Bullish
Timeframe : Weekly
Near a new HIGH record (1 month)
Type : Bullish
Timeframe : Weekly
Technical
A technical analysis in Daily of this DANAHER CORP. chart shows a bullish trend. 78.57% of the signals given by moving averages are bullish. Caution: the neutral signals currently given by short-term moving averages show us that the global trend is losing momentum. The Central Indicators market scanner currently does not detect any result that concerns moving averages.
The technical indicators are generally neutral. They do not provide relevant information on the direction of future price movements.
Other results related to technical indicators were also found by the Central Indicators scanner:
Aroon indicator bullish trend
Type : Bullish
Timeframe : Daily
Ichimoku - Bearish crossover : Tenkan & Kijun
Type : Bearish
Timeframe : Daily
Price is back under the pivot point
Type : Bearish
Timeframe : Daily
Price is back under the pivot point
Type : Bearish
Timeframe : Weekly
The Central Patterns scanner, which studies chart patterns, resistances and supports, has identified these signals:
Near horizontal support
Type : Bullish
Timeframe : Daily
Near support of channel
Type : Bullish
Timeframe : Daily
The Central Candlesticks scanner which studies Japanese candlesticks did not detect anything.
| S3 | S2 | S1 | Price | R1 | R2 | |
|---|---|---|---|---|---|---|
| ProTrendLines | 234.69 | 252.52 | 267.69 | 268.02 | 280.76 | 291.60 |
| Change (%) | -12.44% | -5.78% | -0.12% | - | +4.75% | +8.80% |
| Change | -33.33 | -15.50 | -0.33 | - | +12.74 | +23.58 |
| Level | Major | Major | Major | - | Major | Major |
Attention could also be paid to pivot points to set price objectives:
| Pivot points | S3 | S2 | S1 | PP | R1 | R2 | R3 |
|---|---|---|---|---|---|---|---|
| Standard | 263.91 | 265.64 | 266.86 | 268.59 | 269.81 | 271.54 | 272.76 |
| Camarilla | 267.26 | 267.53 | 267.80 | 268.07 | 268.34 | 268.61 | 268.88 |
| Woodie | 263.65 | 265.51 | 266.60 | 268.46 | 269.55 | 271.41 | 272.50 |
| Fibonacci | 265.64 | 266.77 | 267.47 | 268.59 | 269.72 | 270.42 | 271.54 |
| Pivot points | S3 | S2 | S1 | PP | R1 | R2 | R3 |
|---|---|---|---|---|---|---|---|
| Standard | 258.52 | 262.42 | 265.95 | 269.85 | 273.38 | 277.28 | 280.81 |
| Camarilla | 267.44 | 268.12 | 268.80 | 269.48 | 270.16 | 270.84 | 271.52 |
| Woodie | 258.34 | 262.33 | 265.77 | 269.76 | 273.20 | 277.19 | 280.63 |
| Fibonacci | 262.42 | 265.26 | 267.01 | 269.85 | 272.69 | 274.44 | 277.28 |
| Pivot points | S3 | S2 | S1 | PP | R1 | R2 | R3 |
|---|---|---|---|---|---|---|---|
| Standard | 207.62 | 222.79 | 249.93 | 265.10 | 292.24 | 307.41 | 334.55 |
| Camarilla | 265.45 | 269.32 | 273.20 | 277.08 | 280.96 | 284.84 | 288.72 |
| Woodie | 213.62 | 225.78 | 255.93 | 268.09 | 298.24 | 310.40 | 340.55 |
| Fibonacci | 222.79 | 238.95 | 248.93 | 265.10 | 281.26 | 291.24 | 307.41 |
Numerical data
The following is the status of technical indicators and moving averages registered at the time this technical analysis was created:
| RSI (14): | 52.02 | |
| MACD (12,26,9): | 2.1000 | |
| Directional Movement: | -0.24 | |
| AROON (14): | 71.43 | |
| DEMA (21): | 271.29 | |
| Parabolic SAR (0,02-0,02-0,2): | 273.16 | |
| Elder Ray (13): | -0.50 | |
| Super Trend (3,10): | 259.48 | |
| Zig ZAG (10): | 267.84 | |
| VORTEX (21): | 0.9300 | |
| Stochastique (14,3,5): | 49.70 | |
| TEMA (21): | 270.43 | |
| Williams %R (14): | -57.48 | |
| Chande Momentum Oscillator (20): | -0.28 | |
| Repulse (5,40,3): | -1.4800 | |
| ROCnROLL: | -1 | |
| TRIX (15,9): | 0.1800 | |
| Courbe Coppock: | 0.97 |
| MA7: | 269.60 | |
| MA20: | 270.14 | |
| MA50: | 259.43 | |
| MA100: | 256.14 | |
| MAexp7: | 268.88 | |
| MAexp20: | 267.91 | |
| MAexp50: | 262.97 | |
| MAexp100: | 257.02 | |
| Price / MA7: | -0.59% | |
| Price / MA20: | -0.78% | |
| Price / MA50: | +3.31% | |
| Price / MA100: | +4.64% | |
| Price / MAexp7: | -0.32% | |
| Price / MAexp20: | +0.04% | |
| Price / MAexp50: | +1.92% | |
| Price / MAexp100: | +4.28% |
News
The last news published on DANAHER CORP. at the time of the generation of this analysis was as follows:
- DEADLINE ACTION ALERT: The Schall Law Firm Encourages Investors in Danaher Corporation with Losses of $100,000 to Contact the Firm
- SHAREHOLDER ACTION NOTICE: The Schall Law Firm Encourages Investors in Danaher Corporation with Losses of $100,000 to Contact the Firm
- SHAREHOLDER ACTION ALERT: The Schall Law Firm Encourages Investors in Danaher Corporation with Losses of $100,000 to Contact the Firm
- SHAREHOLDER ACTION NOTICE: The Schall Law Firm Announces it is Investigating Claims Against Danaher Corporation and Encourages Investors with Losses to Contact the Firm
- INVESTOR ACTION NOTICE: The Schall Law Firm Announces it is Investigating Claims Against Danaher Corporation and Encourages Investors with Losses to Contact the Firm
About author
Online


Add a comment
Comments
0 comments on the analysis DANAHER CORP. - Daily