| Open: | - |
| Change: | - |
| Volume: | - |
| Low: | - |
| High: | - |
| High / Low range: | - |
| Type: | Stocks |
| Ticker: | DHR |
| ISIN: |
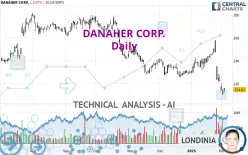
DANAHER CORP. - Daily - Technical analysis published on 02/05/2025 (GMT)
- 93
- 0
- 02/05/2025 - 15:35
Click here for a new analysis!
- Timeframe : Daily
- - Analysis generated on 02/05/2025 - 15:35
- Status : TARGET REACHED

Summary of the analysis

Additional analysis
Quotes
The DANAHER CORP. rating is 214.87 USD. The price is lower by -0.07% since the last closing and was traded between 212.18 USD and 216.44 USD over the period. The price is currently at +1.27% from its lowest and -0.73% from its highest.The Central Gaps scanner detects the formation of a bullish gap marking the strong presence of buyers against sellers at the opening. This formed a quotation gap.
Opening Gap UP
Type : Bullish
Timeframe : Openning
So that you have an overall view of the price change, here is a table showing the variations over several periods:
New LOW record (1 year)
Type : Bearish
Timeframe : Weekly
New LOW record (1st january)
Type : Bearish
Timeframe : Weekly
New LOW record (1 month)
Type : Bearish
Timeframe : Weekly
Technical
Technical analysis of DANAHER CORP. in Daily shows a overall strongly bearish trend. 89.29% of the signals given by moving averages are bearish. This strongly bearish trend is supported by the strong bearish signals given by short-term moving averages. The Central Indicators market scanner currently does not detect any result that concerns moving averages.
In fact, according to the parameters integrated into the Central Analyzer system, only 9 technical indicators out of 18 analysed are currently bearish. Caution: the Central Indicators scanner currently detects an excess:
RSI indicator is oversold : under 30
Type : Neutral
Timeframe : Daily
CCI indicator is oversold : under -100
Type : Neutral
Timeframe : Daily
Williams %R indicator is oversold : under -80
Type : Neutral
Timeframe : Daily
Central Patterns, the market scanner focusing on chart patterns, resistances and supports found this result:
Support of channel is broken
Type : Bearish
Timeframe : Daily
No result was found by the Central Candlesticks scanner on Japanese candlesticks.
| S3 | S2 | S1 | Price | R1 | R2 | R3 | |
|---|---|---|---|---|---|---|---|
| ProTrendLines | 184.26 | 198.15 | 207.99 | 214.87 | 222.13 | 234.18 | 241.00 |
| Change (%) | -14.25% | -7.78% | -3.20% | - | +3.38% | +8.99% | +12.16% |
| Change | -30.61 | -16.72 | -6.88 | - | +7.26 | +19.31 | +26.13 |
| Level | Major | Minor | Major | - | Major | Major | Intermediate |
To determine price objectives, it is also possible to use the pivot points. Here is the price position in relation to pivot points:
| Pivot points | S3 | S2 | S1 | PP | R1 | R2 | R3 |
|---|---|---|---|---|---|---|---|
| Standard | 206.54 | 208.29 | 211.65 | 213.40 | 216.76 | 218.51 | 221.87 |
| Camarilla | 213.61 | 214.07 | 214.54 | 215.01 | 215.48 | 215.95 | 216.42 |
| Woodie | 207.35 | 208.69 | 212.46 | 213.80 | 217.57 | 218.91 | 222.68 |
| Fibonacci | 208.29 | 210.24 | 211.45 | 213.40 | 215.35 | 216.56 | 218.51 |
| Pivot points | S3 | S2 | S1 | PP | R1 | R2 | R3 |
|---|---|---|---|---|---|---|---|
| Standard | 173.09 | 197.21 | 209.98 | 234.10 | 246.87 | 270.99 | 283.76 |
| Camarilla | 212.60 | 215.98 | 219.36 | 222.74 | 226.12 | 229.50 | 232.89 |
| Woodie | 167.41 | 194.37 | 204.30 | 231.26 | 241.19 | 268.15 | 278.08 |
| Fibonacci | 197.21 | 211.31 | 220.01 | 234.10 | 248.20 | 256.90 | 270.99 |
Numerical data
The following is the status of technical indicators and moving averages registered at the time this technical analysis was created:
| RSI (14): | 29.91 | |
| MACD (12,26,9): | -4.7800 | |
| Directional Movement: | -18.76 | |
| AROON (14): | -35.72 | |
| DEMA (21): | 225.87 | |
| Parabolic SAR (0,02-0,02-0,2): | 249.43 | |
| Elder Ray (13): | -13.46 | |
| Super Trend (3,10): | 234.30 | |
| Zig ZAG (10): | 214.02 | |
| VORTEX (21): | 0.9600 | |
| Stochastique (14,3,5): | 6.29 | |
| TEMA (21): | 221.81 | |
| Williams %R (14): | -91.70 | |
| Chande Momentum Oscillator (20): | -24.32 | |
| Repulse (5,40,3): | -2.2000 | |
| ROCnROLL: | 2 | |
| TRIX (15,9): | -0.0500 | |
| Courbe Coppock: | 12.54 |
| MA7: | 223.03 | |
| MA20: | 234.99 | |
| MA50: | 234.07 | |
| MA100: | 246.68 | |
| MAexp7: | 222.14 | |
| MAexp20: | 230.66 | |
| MAexp50: | 235.80 | |
| MAexp100: | 242.14 | |
| Price / MA7: | -3.66% | |
| Price / MA20: | -8.56% | |
| Price / MA50: | -8.20% | |
| Price / MA100: | -12.90% | |
| Price / MAexp7: | -3.27% | |
| Price / MAexp20: | -6.85% | |
| Price / MAexp50: | -8.88% | |
| Price / MAexp100: | -11.26% |
News
Don't forget to follow the news on DANAHER CORP.. At the time of publication of this analysis, the latest news was as follows:
- 09/08/2023 - 04:00 DEADLINE ACTION ALERT: The Schall Law Firm Encourages Investors in Danaher Corporation with Losses of $100,000 to Contact the Firm
- 09/04/2023 - 14:55 SHAREHOLDER ACTION NOTICE: The Schall Law Firm Encourages Investors in Danaher Corporation with Losses of $100,000 to Contact the Firm
- 08/08/2023 - 23:15 SHAREHOLDER ACTION ALERT: The Schall Law Firm Encourages Investors in Danaher Corporation with Losses of $100,000 to Contact the Firm
- 05/24/2023 - 22:30 SHAREHOLDER ACTION NOTICE: The Schall Law Firm Announces it is Investigating Claims Against Danaher Corporation and Encourages Investors with Losses to Contact the Firm
- 05/22/2023 - 23:50 INVESTOR ACTION NOTICE: The Schall Law Firm Announces it is Investigating Claims Against Danaher Corporation and Encourages Investors with Losses to Contact the Firm
About author
Online


Add a comment
Comments
0 comments on the analysis DANAHER CORP. - Daily