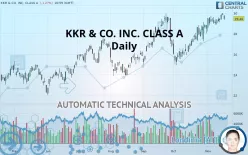
KKR & CO. INC. - Daily - Technical analysis published on 11/19/2019 (GMT)
- 382
- 0
- Who voted?
Click here for a new analysis!
- Timeframe : Daily
- - Analysis generated on
- Status : TARGET REACHED

Summary of the analysis

Additional analysis
Quotes
The KKR & CO. INC. CLASS A rating is 29.46 USD. The price is lower by -1.27% since the last closing and was traded between 29.34 USD and 29.75 USD over the period. The price is currently at +0.41% from its lowest and -0.97% from its highest.The Central Gaps scanner detects a bearish gap which is a sign that the sellers have taken the lead in the very short term.
Opening Gap DOWN
Type : Bearish
Timeframe : Openning
So that you have an overall view of the price change, here is a table showing the variations over several periods:
Near a new HIGH record (5 years)
Type : Bullish
Timeframe : Weekly
Near a new HIGH record (1 year)
Type : Bullish
Timeframe : Weekly
Near a new HIGH record (1st january)
Type : Bullish
Timeframe : Weekly
Near a new HIGH record (1 month)
Type : Bullish
Timeframe : Weekly
Technical
Technical analysis of this Daily chart of KKR & CO. INC. CLASS A indicates that the overall trend is strongly bullish. 92.86% of the signals given by moving averages are bullish. The overall trend is supported by the strong bullish signals from short-term moving averages. There is no crossing of moving average by the price or crossing of moving averages between themselves.
The probability of a further increase are moderate given the direction of the technical indicators.
Caution: the Central Indicators scanner currently detects an excess:
CCI indicator is overbought : over 100
Type : Neutral
Timeframe : Daily
MACD indicator: bearish divergence
Type : Bearish
Timeframe : Daily
Williams %R indicator is overbought : over -20
Type : Neutral
Timeframe : Daily
Pivot points : price is under support 3
Type : Neutral
Timeframe : Daily
Price is back over the pivot point
Type : Bullish
Timeframe : Weekly
The Central Patterns scanner, which studies chart patterns, resistances and supports, has identified this signal:
Horizontal support is broken
Type : Bearish
Timeframe : Daily
The Central Candlesticks scanner which studies Japanese candlesticks did not detect anything.
| S3 | S2 | S1 | Price | R1 | |
|---|---|---|---|---|---|
| ProTrendLines | 25.38 | 27.39 | 28.25 | 29.46 | 29.60 |
| Change (%) | -13.85% | -7.03% | -4.11% | - | +0.48% |
| Change | -4.08 | -2.07 | -1.21 | - | +0.14 |
| Level | Minor | Intermediate | Major | - | Major |
Attention could also be paid to pivot points to set price objectives:
| Pivot points | S3 | S2 | S1 | PP | R1 | R2 | R3 |
|---|---|---|---|---|---|---|---|
| Standard | 29.56 | 29.67 | 29.76 | 29.87 | 29.96 | 30.07 | 30.16 |
| Camarilla | 29.79 | 29.80 | 29.82 | 29.84 | 29.86 | 29.88 | 29.90 |
| Woodie | 29.54 | 29.67 | 29.74 | 29.87 | 29.94 | 30.07 | 30.14 |
| Fibonacci | 29.67 | 29.75 | 29.80 | 29.87 | 29.95 | 30.00 | 30.07 |
| Pivot points | S3 | S2 | S1 | PP | R1 | R2 | R3 |
|---|---|---|---|---|---|---|---|
| Standard | 28.01 | 28.43 | 29.14 | 29.56 | 30.27 | 30.69 | 31.40 |
| Camarilla | 29.53 | 29.63 | 29.74 | 29.84 | 29.94 | 30.05 | 30.15 |
| Woodie | 28.15 | 28.50 | 29.28 | 29.63 | 30.41 | 30.76 | 31.54 |
| Fibonacci | 28.43 | 28.87 | 29.13 | 29.56 | 30.00 | 30.26 | 30.69 |
| Pivot points | S3 | S2 | S1 | PP | R1 | R2 | R3 |
|---|---|---|---|---|---|---|---|
| Standard | 21.78 | 23.29 | 26.00 | 27.51 | 30.22 | 31.74 | 34.44 |
| Camarilla | 27.54 | 27.93 | 28.32 | 28.70 | 29.09 | 29.48 | 29.86 |
| Woodie | 22.37 | 23.59 | 26.59 | 27.81 | 30.81 | 32.03 | 35.03 |
| Fibonacci | 23.29 | 24.91 | 25.90 | 27.51 | 29.13 | 30.12 | 31.74 |
Numerical data
The following is the status of the technical indicators and moving averages at the time of publication of this technical analysis:
| RSI (14): | 61.79 | |
| MACD (12,26,9): | 0.6200 | |
| Directional Movement: | 7.84 | |
| AROON (14): | 92.86 | |
| DEMA (21): | 29.68 | |
| Parabolic SAR (0,02-0,02-0,2): | 29.28 | |
| Elder Ray (13): | 0.35 | |
| Super Trend (3,10): | 27.99 | |
| Zig ZAG (10): | 29.46 | |
| VORTEX (21): | 1.1400 | |
| Stochastique (14,3,5): | 88.38 | |
| TEMA (21): | 29.88 | |
| Williams %R (14): | -24.95 | |
| Chande Momentum Oscillator (20): | 0.76 | |
| Repulse (5,40,3): | -0.1500 | |
| ROCnROLL: | 1 | |
| TRIX (15,9): | 0.3200 | |
| Courbe Coppock: | 8.39 |
| MA7: | 29.48 | |
| MA20: | 28.90 | |
| MA50: | 27.91 | |
| MA100: | 26.75 | |
| MAexp7: | 29.47 | |
| MAexp20: | 28.87 | |
| MAexp50: | 27.90 | |
| MAexp100: | 26.86 | |
| Price / MA7: | -0.07% | |
| Price / MA20: | +1.94% | |
| Price / MA50: | +5.55% | |
| Price / MA100: | +10.13% | |
| Price / MAexp7: | -0.03% | |
| Price / MAexp20: | +2.04% | |
| Price / MAexp50: | +5.59% | |
| Price / MAexp100: | +9.68% |
News
The last news published on KKR & CO. INC. CLASS A at the time of the generation of this analysis was as follows:
- KKR Announces Leadership of Flagship Private Equity Businesses
- KKR & Co. Inc. to Announce Third Quarter 2019 Results
- KKR Acquires Majority Stake in Hyperoptic
- KKR Releases Publication on New Investment Landscape Surrounding “The New Consumer”
- KKR Expands Global Impact Team with Senior Appointments
About author

Online


Add a comment
Comments
0 comments on the analysis KKR & CO. INC. - Daily