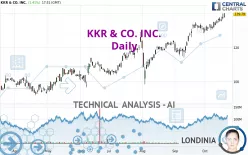
KKR & CO. INC. - Daily - Technical analysis published on 10/18/2024 (GMT)
- 177
- 0
Click here for a new analysis!
- Timeframe : Daily
- - Analysis generated on
- Status : TARGET REACHED

Summary of the analysis

Additional analysis
Quotes
The KKR & CO. INC. price is 139.79 USD. On the day, this instrument gained +1.42% and was traded between 137.35 USD and 140.15 USD over the period. The price is currently at +1.78% from its lowest and -0.26% from its highest.A bullish opening was detected by the Central Gaps scanner. Buyers are trying to impose a bullish momentum in the very short term.
Bullish opening
Type : Bullish
Timeframe : Openning
A study of price movements over other periods shows the following variations:
New HIGH record (5 years)
Type : Bullish
Timeframe : Weekly
New HIGH record (1 year)
Type : Bullish
Timeframe : Weekly
New HIGH record (1st january)
Type : Bullish
Timeframe : Weekly
New HIGH record (1 month)
Type : Bullish
Timeframe : Weekly
Technical
Technical analysis of KKR & CO. INC. in Daily shows a strongly overall bullish trend. 92.86% of the signals given by moving averages are bullish. The overall trend is supported by the strong bullish signals from short-term moving averages. The Central Indicators market scanner currently does not detect any result that concerns moving averages.
Technical indicators are strongly bullish, suggesting that the price increase should continue.
But beware of excesses. The Central Indicators scanner currently detects this:
RSI indicator is overbought : over 70
Type : Neutral
Timeframe : Daily
CCI indicator is overbought : over 100
Type : Neutral
Timeframe : Daily
CCI indicator: bearish divergence
Type : Bearish
Timeframe : Daily
Williams %R indicator is overbought : over -20
Type : Neutral
Timeframe : Daily
Pivot points : price is over resistance 1
Type : Neutral
Timeframe : Daily
Pivot points : price is over resistance 2
Type : Neutral
Timeframe : Weekly
Central Patterns, the scanner specializing in chart patterns, did not identify any signals.
The Central Candlesticks scanner, specialised in Japanese candlesticks, did not identify any signals.
| S3 | S2 | S1 | Price | |
|---|---|---|---|---|
| ProTrendLines | 106.06 | 123.25 | 133.23 | 139.79 |
| Change (%) | -24.13% | -11.83% | -4.69% | - |
| Change | -33.73 | -16.54 | -6.56 | - |
| Level | Minor | Major | Major | - |
To determine price objectives, it is also possible to use the pivot points. Here is the price position in relation to pivot points:
| Pivot points | S3 | S2 | S1 | PP | R1 | R2 | R3 |
|---|---|---|---|---|---|---|---|
| Standard | 132.73 | 134.55 | 136.19 | 138.01 | 139.65 | 141.47 | 143.11 |
| Camarilla | 136.89 | 137.21 | 137.52 | 137.84 | 138.16 | 138.47 | 138.79 |
| Woodie | 132.65 | 134.51 | 136.11 | 137.97 | 139.57 | 141.43 | 143.03 |
| Fibonacci | 134.55 | 135.87 | 136.69 | 138.01 | 139.33 | 140.15 | 141.47 |
| Pivot points | S3 | S2 | S1 | PP | R1 | R2 | R3 |
|---|---|---|---|---|---|---|---|
| Standard | 126.24 | 128.24 | 131.91 | 133.91 | 137.58 | 139.58 | 143.25 |
| Camarilla | 134.03 | 134.55 | 135.07 | 135.59 | 136.11 | 136.63 | 137.15 |
| Woodie | 127.09 | 128.66 | 132.76 | 134.33 | 138.43 | 140.00 | 144.10 |
| Fibonacci | 128.24 | 130.40 | 131.74 | 133.91 | 136.07 | 137.41 | 139.58 |
| Pivot points | S3 | S2 | S1 | PP | R1 | R2 | R3 |
|---|---|---|---|---|---|---|---|
| Standard | 97.12 | 105.52 | 118.05 | 126.45 | 138.98 | 147.38 | 159.91 |
| Camarilla | 124.82 | 126.74 | 128.66 | 130.58 | 132.50 | 134.42 | 136.34 |
| Woodie | 99.19 | 106.55 | 120.12 | 127.48 | 141.05 | 148.41 | 161.98 |
| Fibonacci | 105.52 | 113.52 | 118.46 | 126.45 | 134.45 | 139.39 | 147.38 |
Numerical data
The following are the details of the technical indicators and moving averages that were collected to generate this technical analysis:
| RSI (14): | 70.99 | |
| MACD (12,26,9): | 3.4000 | |
| Directional Movement: | 18.77 | |
| AROON (14): | 100.00 | |
| DEMA (21): | 137.75 | |
| Parabolic SAR (0,02-0,02-0,2): | 135.20 | |
| Elder Ray (13): | 3.78 | |
| Super Trend (3,10): | 129.95 | |
| Zig ZAG (10): | 139.97 | |
| VORTEX (21): | 1.0600 | |
| Stochastique (14,3,5): | 85.84 | |
| TEMA (21): | 138.19 | |
| Williams %R (14): | -1.78 | |
| Chande Momentum Oscillator (20): | 7.73 | |
| Repulse (5,40,3): | 1.6900 | |
| ROCnROLL: | 1 | |
| TRIX (15,9): | 0.3700 | |
| Courbe Coppock: | 7.51 |
| MA7: | 136.33 | |
| MA20: | 133.46 | |
| MA50: | 125.96 | |
| MA100: | 117.77 | |
| MAexp7: | 136.67 | |
| MAexp20: | 133.23 | |
| MAexp50: | 127.01 | |
| MAexp100: | 119.11 | |
| Price / MA7: | +2.54% | |
| Price / MA20: | +4.74% | |
| Price / MA50: | +10.98% | |
| Price / MA100: | +18.70% | |
| Price / MAexp7: | +2.28% | |
| Price / MAexp20: | +4.92% | |
| Price / MAexp50: | +10.06% | |
| Price / MAexp100: | +17.36% |
News
The latest news and videos published on KKR & CO. INC. at the time of the analysis were as follows:
- KKR to Present at the Barclays Financial Services Conference
- KKR Expands Focus on Climate Investing with Key Appointments to Global Infrastructure Team
- KKR Acquires $373 Million Portfolio of Prime Auto Loans
- KKR to Acquire Simon & Schuster from Paramount Global for $1.62 Billion
- KKR & Co. Inc. Reports Second Quarter 2023 Results
About author

Online


Add a comment
Comments
0 comments on the analysis KKR & CO. INC. - Daily