FIRST COMMONWEALTH FINANCIAL - Weekly - Technical analysis published on 07/18/2024 (GMT)
- 110
- 0
- Timeframe : Weekly
- - Analysis generated on
- Status : WITHOUT TARGET
Summary of the analysis

Additional analysis
Quotes
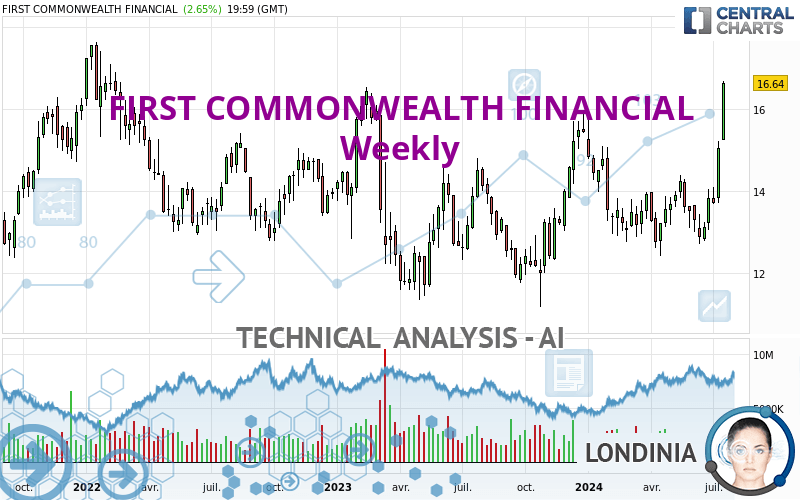
The FIRST COMMONWEALTH FINANCIAL rating is 16.64 USD. The price registered an increase of +15.56% over 5 days and was traded between 15.23 USD and 16.67 USD over the period. The price is currently at +9.26% from its lowest point and -0.18% from its highest point.The Central Gaps scanner detects a bearish opening. A small advantage for sellers in the very short term.
Bearish opening
Type : Bearish
Timeframe : Openning
So that you have an overall view of the price change, here is a table showing the variations over several periods:
New HIGH record (5 years)
Type : Bullish
Timeframe : Weekly
New HIGH record (1 year)
Type : Bullish
Timeframe : Weekly
New HIGH record (1st january)
Type : Bullish
Timeframe : Weekly
New HIGH record (1 month)
Type : Bullish
Timeframe : Weekly
Technical
Technical analysis of FIRST COMMONWEALTH FINANCIAL in Weekly shows a strongly overall bullish trend. 92.86% of the signals given by moving averages are bullish. This strongly bullish trend is supported by the strong bullish signals given by short-term moving averages. The Central Indicators market scanner is currently detecting a bullish signal that could impact this trend:
Bullish trend reversal : Moving Average 100
Type : Bullish
Timeframe : Weekly
In fact, 17 technical indicators on 18 studied are currently bullish. Caution: the Central Indicators scanner currently detects an excess:
RSI indicator is overbought : over 70
Type : Neutral
Timeframe : Weekly
CCI indicator is overbought : over 100
Type : Neutral
Timeframe : Weekly
Williams %R indicator is overbought : over -20
Type : Neutral
Timeframe : Weekly
Pivot points : price is over resistance 2
Type : Neutral
Timeframe : Weekly
The analysis of the price chart with Central Patterns scanners does not return any result.
Central Candlesticks, the scanner specialised in Japanese candlesticks, detects a bullish signal that could support the hypothesis of a small rebound in the very short term:
Upside gap
Type : Bullish
Timeframe : Weekly
| S3 | S2 | S1 | Price | |
|---|---|---|---|---|
| ProTrendLines | 13.96 | 14.64 | 16.20 | 16.64 |
| Change (%) | -16.11% | -12.02% | -2.64% | - |
| Change | -2.68 | -2.00 | -0.44 | - |
| Level | Major | Intermediate | Intermediate | - |
To determine price objectives, it is also possible to use the pivot points. Here is the price position in relation to pivot points:
| Pivot points | S3 | S2 | S1 | PP | R1 | R2 | R3 |
|---|---|---|---|---|---|---|---|
| Standard | 15.53 | 15.77 | 16.20 | 16.44 | 16.87 | 17.11 | 17.54 |
| Camarilla | 16.46 | 16.52 | 16.58 | 16.64 | 16.70 | 16.76 | 16.82 |
| Woodie | 15.64 | 15.82 | 16.31 | 16.49 | 16.98 | 17.16 | 17.65 |
| Fibonacci | 15.77 | 16.02 | 16.18 | 16.44 | 16.69 | 16.85 | 17.11 |
| Pivot points | S3 | S2 | S1 | PP | R1 | R2 | R3 |
|---|---|---|---|---|---|---|---|
| Standard | 12.59 | 13.14 | 14.10 | 14.65 | 15.61 | 16.16 | 17.12 |
| Camarilla | 14.64 | 14.77 | 14.91 | 15.05 | 15.19 | 15.33 | 15.47 |
| Woodie | 12.79 | 13.24 | 14.30 | 14.75 | 15.81 | 16.26 | 17.32 |
| Fibonacci | 13.14 | 13.72 | 14.08 | 14.65 | 15.23 | 15.59 | 16.16 |
| Pivot points | S3 | S2 | S1 | PP | R1 | R2 | R3 |
|---|---|---|---|---|---|---|---|
| Standard | 11.67 | 12.19 | 13.00 | 13.52 | 14.33 | 14.85 | 15.66 |
| Camarilla | 13.44 | 13.57 | 13.69 | 13.81 | 13.93 | 14.05 | 14.18 |
| Woodie | 11.82 | 12.26 | 13.15 | 13.59 | 14.48 | 14.92 | 15.81 |
| Fibonacci | 12.19 | 12.70 | 13.01 | 13.52 | 14.03 | 14.34 | 14.85 |
Numerical data
The following is the status of technical indicators and moving averages registered at the time this technical analysis was created:
| RSI (14): | 70.77 | |
| MACD (12,26,9): | 0.3700 | |
| Directional Movement: | 24.03 | |
| AROON (14): | 92.86 | |
| DEMA (21): | 14.28 | |
| Parabolic SAR (0,02-0,02-0,2): | 12.98 | |
| Elder Ray (13): | 1.81 | |
| Super Trend (3,10): | 13.37 | |
| Zig ZAG (10): | 16.56 | |
| VORTEX (21): | 1.1300 | |
| Stochastique (14,3,5): | 87.41 | |
| TEMA (21): | 14.57 | |
| Williams %R (14): | -0.23 | |
| Chande Momentum Oscillator (20): | 3.17 | |
| Repulse (5,40,3): | 18.5400 | |
| ROCnROLL: | 1 | |
| TRIX (15,9): | 0.1200 | |
| Courbe Coppock: | 16.44 |
| MA7: | 15.27 | |
| MA20: | 14.14 | |
| MA50: | 13.77 | |
| MA100: | 13.46 | |
| MAexp7: | 14.57 | |
| MAexp20: | 13.89 | |
| MAexp50: | 13.54 | |
| MAexp100: | 13.26 | |
| Price / MA7: | +8.97% | |
| Price / MA20: | +17.68% | |
| Price / MA50: | +20.84% | |
| Price / MA100: | +23.63% | |
| Price / MAexp7: | +14.21% | |
| Price / MAexp20: | +19.80% | |
| Price / MAexp50: | +22.90% | |
| Price / MAexp100: | +25.49% |
News
The latest news and videos published on FIRST COMMONWEALTH FINANCIAL at the time of the analysis were as follows:
- Investor Network: First Commonwealth Financial Corporation to Host Earnings Call
- DCB Financial Corp Receives Shareholder Approval for Merger with First Commonwealth Financial Corporation
About author

Online


Add a comment
Comments
0 comments on the analysis FIRST COMMONWEALTH FINANCIAL - Weekly