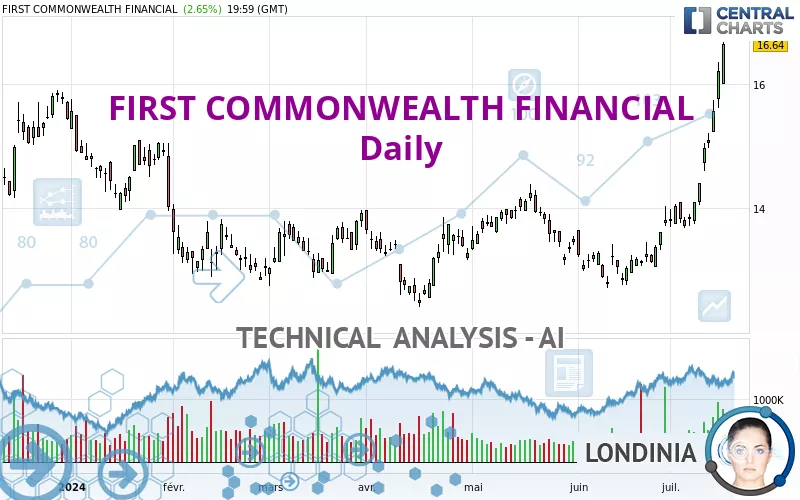
FIRST COMMONWEALTH FINANCIAL - Daily - Technical analysis published on 07/18/2024 (GMT)
- 142
- 0
- Timeframe : Daily
- - Analysis generated on
- Status : WITHOUT TARGET

Summary of the analysis

Additional analysis
Quotes
The FIRST COMMONWEALTH FINANCIAL rating is 16.64 USD. The price registered an increase of +2.65% on the session with the lowest point at 16.00 USD and the highest point at 16.67 USD. The deviation from the price is +4.00% for the low point and -0.18% for the high point.The Central Gaps scanner detects a bearish opening marking the presence of sellers ahead of buyers at the opening but not sufficiently marked to allow the price to register a quotation gap.
Bearish opening
Type : Bearish
Timeframe : Openning
Here is a more detailed summary of the historical variations registered by FIRST COMMONWEALTH FINANCIAL:
New HIGH record (5 years)
Type : Bullish
Timeframe : Weekly
New HIGH record (1 year)
Type : Bullish
Timeframe : Weekly
New HIGH record (1st january)
Type : Bullish
Timeframe : Weekly
New HIGH record (1 month)
Type : Bullish
Timeframe : Weekly
Technical
Technical analysis of FIRST COMMONWEALTH FINANCIAL in Daily shows a strongly overall bullish trend. 92.86% of the signals given by moving averages are bullish. This strongly bullish trend is supported by the strong bullish signals given by short-term moving averages. There is no crossing of moving average by the price or crossing of moving averages between themselves.
In fact, according to the parameters integrated into the Central Analyzer system, 17 technical indicators out of 18 analysed are currently bullish. Caution: the Central Indicators scanner currently detects an excess:
RSI indicator is overbought : over 80
Type : Neutral
Timeframe : Daily
CCI indicator is overbought : over 100
Type : Neutral
Timeframe : Daily
Previous candle closed over Bollinger bands
Type : Neutral
Timeframe : Daily
CCI indicator: bearish divergence
Type : Bearish
Timeframe : Daily
Williams %R indicator is overbought : over -20
Type : Neutral
Timeframe : Daily
Pivot points : price is over resistance 1
Type : Neutral
Timeframe : Daily
Pivot points : price is over resistance 2
Type : Neutral
Timeframe : Weekly
No signals are given by Central Patterns, a market scanner specialised in chart patterns, resistances and supports.
No result was found by the Central Candlesticks scanner on Japanese candlesticks.
| S3 | S2 | S1 | Price | |
|---|---|---|---|---|
| ProTrendLines | 14.64 | 15.50 | 16.20 | 16.64 |
| Change (%) | -12.02% | -6.85% | -2.64% | - |
| Change | -2.00 | -1.14 | -0.44 | - |
| Level | Intermediate | Intermediate | Intermediate | - |
Attention could also be paid to pivot points to set price objectives:
| Pivot points | S3 | S2 | S1 | PP | R1 | R2 | R3 |
|---|---|---|---|---|---|---|---|
| Standard | 15.53 | 15.77 | 16.20 | 16.44 | 16.87 | 17.11 | 17.54 |
| Camarilla | 16.46 | 16.52 | 16.58 | 16.64 | 16.70 | 16.76 | 16.82 |
| Woodie | 15.64 | 15.82 | 16.31 | 16.49 | 16.98 | 17.16 | 17.65 |
| Fibonacci | 15.77 | 16.02 | 16.18 | 16.44 | 16.69 | 16.85 | 17.11 |
| Pivot points | S3 | S2 | S1 | PP | R1 | R2 | R3 |
|---|---|---|---|---|---|---|---|
| Standard | 12.59 | 13.14 | 14.10 | 14.65 | 15.61 | 16.16 | 17.12 |
| Camarilla | 14.64 | 14.77 | 14.91 | 15.05 | 15.19 | 15.33 | 15.47 |
| Woodie | 12.79 | 13.24 | 14.30 | 14.75 | 15.81 | 16.26 | 17.32 |
| Fibonacci | 13.14 | 13.72 | 14.08 | 14.65 | 15.23 | 15.59 | 16.16 |
| Pivot points | S3 | S2 | S1 | PP | R1 | R2 | R3 |
|---|---|---|---|---|---|---|---|
| Standard | 11.67 | 12.19 | 13.00 | 13.52 | 14.33 | 14.85 | 15.66 |
| Camarilla | 13.44 | 13.57 | 13.69 | 13.81 | 13.93 | 14.05 | 14.18 |
| Woodie | 11.82 | 12.26 | 13.15 | 13.59 | 14.48 | 14.92 | 15.81 |
| Fibonacci | 12.19 | 12.70 | 13.01 | 13.52 | 14.03 | 14.34 | 14.85 |
Numerical data
The following is the status of the technical indicators and moving averages at the time of publication of this technical analysis:
| RSI (14): | 85.03 | |
| MACD (12,26,9): | 0.6700 | |
| Directional Movement: | 49.07 | |
| AROON (14): | 100.00 | |
| DEMA (21): | 15.22 | |
| Parabolic SAR (0,02-0,02-0,2): | 14.83 | |
| Elder Ray (13): | 1.46 | |
| Super Trend (3,10): | 15.05 | |
| Zig ZAG (10): | 16.64 | |
| VORTEX (21): | 1.3500 | |
| Stochastique (14,3,5): | 96.06 | |
| TEMA (21): | 15.77 | |
| Williams %R (14): | -0.90 | |
| Chande Momentum Oscillator (20): | 2.83 | |
| Repulse (5,40,3): | 9.3600 | |
| ROCnROLL: | 1 | |
| TRIX (15,9): | 0.3700 | |
| Courbe Coppock: | 29.91 |
| MA7: | 15.27 | |
| MA20: | 14.14 | |
| MA50: | 13.77 | |
| MA100: | 13.46 | |
| MAexp7: | 15.47 | |
| MAexp20: | 14.49 | |
| MAexp50: | 13.91 | |
| MAexp100: | 13.66 | |
| Price / MA7: | +8.97% | |
| Price / MA20: | +17.68% | |
| Price / MA50: | +20.84% | |
| Price / MA100: | +23.63% | |
| Price / MAexp7: | +7.56% | |
| Price / MAexp20: | +14.84% | |
| Price / MAexp50: | +19.63% | |
| Price / MAexp100: | +21.82% |
News
The last news published on FIRST COMMONWEALTH FINANCIAL at the time of the generation of this analysis was as follows:
- Investor Network: First Commonwealth Financial Corporation to Host Earnings Call
- DCB Financial Corp Receives Shareholder Approval for Merger with First Commonwealth Financial Corporation
About author

Online


Add a comment
Comments
0 comments on the analysis FIRST COMMONWEALTH FINANCIAL - Daily