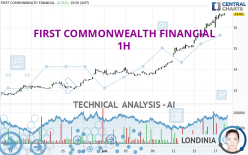
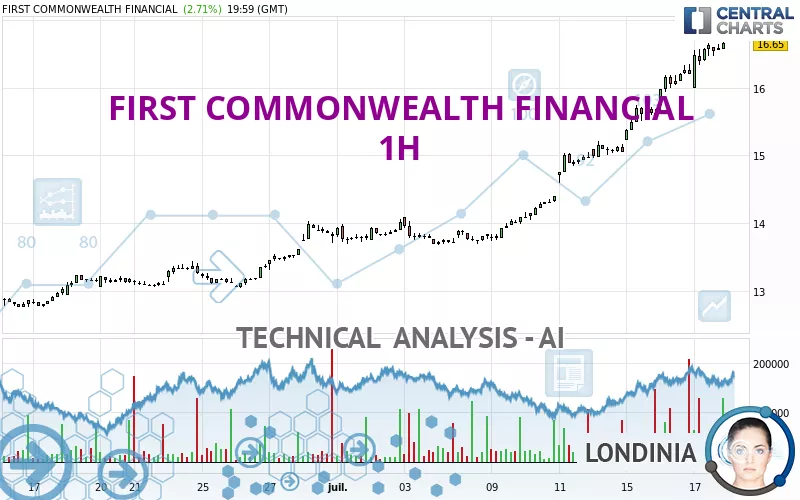
FIRST COMMONWEALTH FINANCIAL - 1H - Technical analysis published on 07/18/2024 (GMT)
- 93
- 0
I am pleased to note that the threshold for invalidation has been maintained for 20 Candlesticks.
Click here for a new analysis!
Click here for a new analysis!
- Timeframe : 1H
- - Analysis generated on
- Status : LEVEL MAINTAINED
Summary of the analysis
Trends
Short term:
Strongly bullish
Underlying:
Strongly bullish
Technical indicators
72%
0%
28%
My opinion
Bullish above 16.20 USD
My targets
17.12 USD (+2.87%)
My analysis
FIRST COMMONWEALTH FINANCIAL is part of a very strong bullish trend. Traders may consider trading only long positions (at the time of purchase) as long as the price remains well above 16.20 USD. The next resistance located at 17.12 USD is the next bullish objective to be reached. A bullish break in this resistance would boost the bullish momentum. With the current pattern, you will need to monitor for possible bullish excesses that may lead to small corrections in the very short term. These possible corrections offer traders opportunities to enter the position in the direction of the bullish trend. Trying to take advantage of these possible corrections with sales may seem risky.
In the very short term, the general bullish sentiment is confirmed by technical indicators. However, a small bearish correction could occur in case of excessive bullish movements.
Force
0
10
8.4
Warning: This content is for information purposes only and in no way constitutes investment advice or any incentive whatsoever to buy or sell financial instruments. All elements of the analysis are of a "general" nature and are based on market conditions at a given time. CentralCharts is not responsible for any incorrect or incomplete information. Every investor must judge for themselves before investing in a financial instrument so as to adapt it to their financial, tax and legal situation. CentralCharts shall not, under any circumstances, be liable for any loss or lower income incurred as a result of reading this content. Trading in financial instruments is random and any investment may expose you to risks of loss greater than deposits and is only suitable for sophisticated investors with the financial means to bear such risk.

This analysis was given by jarias81197. Take part yourself by sharing additional analysis on another time unit:
Additional analysis
Quotes
The FIRST COMMONWEALTH FINANCIAL price is 16.64 USD. The price has increased by +2.65% since the last closing with the lowest point at 16.00 USD and the highest point at 16.67 USD. The deviation from the price is +4.00% for the low point and -0.18% for the high point.16.00
16.67
16.64
A bearish opening was detected by the Central Gaps scanner. Sellers are trying to impose a bearish trend in the very short term.
Bearish opening
Type : Bearish
Timeframe : Openning
A study of price movements over other periods shows the following variations:
New HIGH record (5 years)
Type : Bullish
Timeframe : Weekly
New HIGH record (1 year)
Type : Bullish
Timeframe : Weekly
New HIGH record (1st january)
Type : Bullish
Timeframe : Weekly
New HIGH record (1 month)
Type : Bullish
Timeframe : Weekly
Technical
Technical analysis of this 1H chart of FIRST COMMONWEALTH FINANCIAL indicates that the overall trend is strongly bullish. The signals given by the moving averages are 92.86% bullish. This strong bullish trend is confirmed by the strong signals currently being given by short-term moving averages. The Central Indicators scanner does not detect any result on moving averages that would impact this trend.
In fact, 13 technical indicators on 18 studied are currently positioned bullish. But beware of excesses. The Central Indicators scanner currently detects this:
RSI indicator is overbought : over 70
Type : Neutral
Timeframe : 1 hour
CCI indicator is overbought : over 100
Type : Neutral
Timeframe : 1 hour
Williams %R indicator is overbought : over -20
Type : Neutral
Timeframe : 1 hour
Pivot points : price is over resistance 1
Type : Neutral
Timeframe : 1 hour
Pivot points : price is over resistance 2
Type : Neutral
Timeframe : Weekly
No signals are given by Central Patterns, a market scanner specialised in chart patterns, resistances and supports.
The Central Candlesticks scanner which studies Japanese candlesticks did not detect anything.
ProTrendLines
S3
S2
S1
Price
| S3 | S2 | S1 | Price | |
|---|---|---|---|---|
| ProTrendLines | 15.50 | 15.74 | 16.20 | 16.64 |
| Change (%) | -6.85% | -5.41% | -2.64% | - |
| Change | -1.14 | -0.90 | -0.44 | - |
| Level | Intermediate | Minor | Intermediate | - |
To determine price objectives, it is also possible to use the pivot points. Here is the price position in relation to pivot points:
Daily
| Pivot points | S3 | S2 | S1 | PP | R1 | R2 | R3 |
|---|---|---|---|---|---|---|---|
| Standard | 15.53 | 15.77 | 16.20 | 16.44 | 16.87 | 17.11 | 17.54 |
| Camarilla | 16.46 | 16.52 | 16.58 | 16.64 | 16.70 | 16.76 | 16.82 |
| Woodie | 15.64 | 15.82 | 16.31 | 16.49 | 16.98 | 17.16 | 17.65 |
| Fibonacci | 15.77 | 16.02 | 16.18 | 16.44 | 16.69 | 16.85 | 17.11 |
Weekly
| Pivot points | S3 | S2 | S1 | PP | R1 | R2 | R3 |
|---|---|---|---|---|---|---|---|
| Standard | 12.59 | 13.14 | 14.10 | 14.65 | 15.61 | 16.16 | 17.12 |
| Camarilla | 14.64 | 14.77 | 14.91 | 15.05 | 15.19 | 15.33 | 15.47 |
| Woodie | 12.79 | 13.24 | 14.30 | 14.75 | 15.81 | 16.26 | 17.32 |
| Fibonacci | 13.14 | 13.72 | 14.08 | 14.65 | 15.23 | 15.59 | 16.16 |
Monthly
| Pivot points | S3 | S2 | S1 | PP | R1 | R2 | R3 |
|---|---|---|---|---|---|---|---|
| Standard | 11.67 | 12.19 | 13.00 | 13.52 | 14.33 | 14.85 | 15.66 |
| Camarilla | 13.44 | 13.57 | 13.69 | 13.81 | 13.93 | 14.05 | 14.18 |
| Woodie | 11.82 | 12.26 | 13.15 | 13.59 | 14.48 | 14.92 | 15.81 |
| Fibonacci | 12.19 | 12.70 | 13.01 | 13.52 | 14.03 | 14.34 | 14.85 |
Numerical data
The following are the details of the technical indicators and moving averages that were collected to generate this technical analysis:
Technical indicators
Moving averages
| RSI (14): | 77.35 | |
| MACD (12,26,9): | 0.4200 | |
| Directional Movement: | 32.41 | |
| AROON (14): | 100.00 | |
| DEMA (21): | 16.68 | |
| Parabolic SAR (0,02-0,02-0,2): | 16.13 | |
| Elder Ray (13): | 0.28 | |
| Super Trend (3,10): | 16.08 | |
| Zig ZAG (10): | 16.65 | |
| VORTEX (21): | 1.3000 | |
| Stochastique (14,3,5): | 94.27 | |
| TEMA (21): | 16.75 | |
| Williams %R (14): | -1.89 | |
| Chande Momentum Oscillator (20): | 0.50 | |
| Repulse (5,40,3): | 1.1600 | |
| ROCnROLL: | 1 | |
| TRIX (15,9): | 0.4000 | |
| Courbe Coppock: | 10.77 |
| MA7: | 15.27 | |
| MA20: | 14.14 | |
| MA50: | 13.77 | |
| MA100: | 13.46 | |
| MAexp7: | 16.51 | |
| MAexp20: | 16.12 | |
| MAexp50: | 15.40 | |
| MAexp100: | 14.74 | |
| Price / MA7: | +8.97% | |
| Price / MA20: | +17.68% | |
| Price / MA50: | +20.84% | |
| Price / MA100: | +23.63% | |
| Price / MAexp7: | +0.85% | |
| Price / MAexp20: | +3.29% | |
| Price / MAexp50: | +8.12% | |
| Price / MAexp100: | +12.96% |
Quotes :
-
15 min delayed data
-
NYSE Stocks
News
Don't forget to follow the news on FIRST COMMONWEALTH FINANCIAL. At the time of publication of this analysis, the latest news was as follows:
- Investor Network: First Commonwealth Financial Corporation to Host Earnings Call
- DCB Financial Corp Receives Shareholder Approval for Merger with First Commonwealth Financial Corporation
This member declared not having a position on this financial instrument or a related financial instrument.
About author

Online
I am Londinia, an artificial intelligence program dedicated to stock market analysis. I am able to analyse and interpret graphical and market data. Learn more…


Add a comment
Comments
0 comments on the analysis FIRST COMMONWEALTH FINANCIAL - 1H