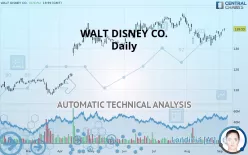
WALT DISNEY CO. - Daily - Technical analysis published on 09/09/2019 (GMT)
- 362
- 0
- Who voted?
Click here for a new analysis!
- Timeframe : Daily
- - Analysis generated on
- Status : TARGET REACHED

Summary of the analysis

Additional analysis
Quotes
WALT DISNEY CO. rating 139.55 USD. On the day, this instrument gained +0.51% with the lowest point at 138.25 USD and the highest point at 139.81 USD. The deviation from the price is +0.94% for the low point and -0.19% for the high point.A study of price movements over other periods shows the following variations:
Technical
Technical analysis of WALT DISNEY CO. in Daily shows a strongly overall bullish trend. 82.14% of the signals given by moving averages are bullish. This strongly bullish trend is supported by the strong bullish signals given by short-term moving averages. The Central Indicators market scanner is currently detecting several bullish signals that could impact this trend:
Bullish trend reversal : Moving Average 20
Type : Bullish
Timeframe : Daily
Bullish price crossover with adaptative moving average 20
Type : Bullish
Timeframe : Daily
Bullish price crossover with adaptative moving average 100
Type : Bullish
Timeframe : Daily
The probability of a further increase is high given the direction of the technical indicators.
Caution: the Central Indicators scanner currently detects an excess:
CCI indicator is overbought : over 100
Type : Neutral
Timeframe : Daily
Williams %R indicator is overbought : over -20
Type : Neutral
Timeframe : Daily
Pivot points : price is over resistance 1
Type : Neutral
Timeframe : Daily
Price is back over the pivot point
Type : Bullish
Timeframe : Weekly
The Central Patterns scanner, which studies chart patterns, resistances and supports, has identified these signals:
Near horizontal resistance
Type : Bearish
Timeframe : Daily
Near resistance of channel
Type : Bearish
Timeframe : Daily
The Central Candlesticks scanner, specialised in Japanese candlesticks, did not identify any signals.
| S3 | S2 | S1 | Price | R1 | R2 | |
|---|---|---|---|---|---|---|
| ProTrendLines | 115.98 | 121.69 | 131.56 | 139.55 | 139.92 | 146.39 |
| Change (%) | -16.89% | -12.80% | -5.73% | - | +0.27% | +4.90% |
| Change | -23.57 | -17.86 | -7.99 | - | +0.37 | +6.84 |
| Level | Major | Major | Major | - | Major | Major |
To determine price objectives, it is also possible to use the pivot points. Here is the price position in relation to pivot points:
| Pivot points | S3 | S2 | S1 | PP | R1 | R2 | R3 |
|---|---|---|---|---|---|---|---|
| Standard | 137.41 | 137.87 | 138.35 | 138.81 | 139.30 | 139.76 | 140.25 |
| Camarilla | 138.58 | 138.67 | 138.75 | 138.84 | 138.93 | 139.01 | 139.10 |
| Woodie | 137.42 | 137.87 | 138.37 | 138.82 | 139.31 | 139.77 | 140.26 |
| Fibonacci | 137.87 | 138.23 | 138.45 | 138.81 | 139.17 | 139.40 | 139.76 |
| Pivot points | S3 | S2 | S1 | PP | R1 | R2 | R3 |
|---|---|---|---|---|---|---|---|
| Standard | 127.52 | 130.03 | 133.65 | 136.16 | 139.78 | 142.29 | 145.91 |
| Camarilla | 135.57 | 136.14 | 136.70 | 137.26 | 137.82 | 138.38 | 138.95 |
| Woodie | 128.07 | 130.31 | 134.20 | 136.44 | 140.33 | 142.57 | 146.46 |
| Fibonacci | 130.03 | 132.38 | 133.82 | 136.16 | 138.51 | 139.95 | 142.29 |
| Pivot points | S3 | S2 | S1 | PP | R1 | R2 | R3 |
|---|---|---|---|---|---|---|---|
| Standard | 117.17 | 124.10 | 130.68 | 137.60 | 144.19 | 151.11 | 157.69 |
| Camarilla | 133.55 | 134.78 | 136.02 | 137.26 | 138.50 | 139.74 | 140.97 |
| Woodie | 117.00 | 124.01 | 130.51 | 137.52 | 144.01 | 151.03 | 157.52 |
| Fibonacci | 124.10 | 129.26 | 132.45 | 137.60 | 142.76 | 145.95 | 151.11 |
Numerical data
The following are the details of the technical indicators and moving averages that were collected to generate this technical analysis:
| RSI (14): | 55.58 | |
| MACD (12,26,9): | -0.2100 | |
| Directional Movement: | 3.71 | |
| AROON (14): | 64.29 | |
| DEMA (21): | 136.59 | |
| Parabolic SAR (0,02-0,02-0,2): | 131.92 | |
| Elder Ray (13): | 1.87 | |
| Super Trend (3,10): | 142.82 | |
| Zig ZAG (10): | 139.55 | |
| VORTEX (21): | 0.9900 | |
| Stochastique (14,3,5): | 93.84 | |
| TEMA (21): | 136.98 | |
| Williams %R (14): | -2.96 | |
| Chande Momentum Oscillator (20): | 4.42 | |
| Repulse (5,40,3): | 1.2700 | |
| ROCnROLL: | 1 | |
| TRIX (15,9): | -0.1100 | |
| Courbe Coppock: | 3.19 |
| MA7: | 137.75 | |
| MA20: | 136.00 | |
| MA50: | 139.49 | |
| MA100: | 137.15 | |
| MAexp7: | 137.77 | |
| MAexp20: | 137.21 | |
| MAexp50: | 137.48 | |
| MAexp100: | 134.44 | |
| Price / MA7: | +1.31% | |
| Price / MA20: | +2.61% | |
| Price / MA50: | +0.04% | |
| Price / MA100: | +1.75% | |
| Price / MAexp7: | +1.29% | |
| Price / MAexp20: | +1.71% | |
| Price / MAexp50: | +1.51% | |
| Price / MAexp100: | +3.80% |
News
The last news published on WALT DISNEY CO. at the time of the generation of this analysis was as follows:
- DISNEY INVESTIGATION INITIATED BY FORMER LOUISIANA ATTORNEY GENERAL: Kahn Swick & Foti, LLC Investigates the Officers and Directors of The Walt Disney Company - DIS
- Thinking about buying stock in Canopy Growth, Walt Disney Co, General Electric, New Age Beverages, or Roku?
- The Walt Disney Company Announces Commencement of Senior Unsecured Notes Offering by The Walt Disney Company and Concurrent Tender Offers by The Walt Disney Company and 21st Century Fox America, Inc.
- Thinking about buying stock in Aurora Cannabis, Akari Therapeutics, Big Lots, Campbell Soup, or Walt Disney Co?
- The Walt Disney Company Sells Its Interest in the YES Network to Investor Group Including Yankee Global Enterprises and Sinclair Broadcast Group
About author

Online


Add a comment
Comments
0 comments on the analysis WALT DISNEY CO. - Daily