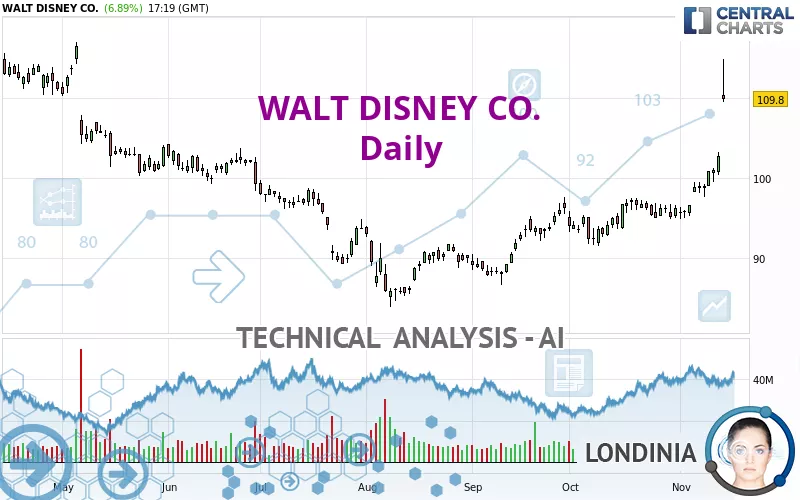
WALT DISNEY CO. - Daily - Technical analysis published on 11/14/2024 (GMT)
- 149
- 0
Click here for a new analysis!
- Timeframe : Daily
- - Analysis generated on
- Status : TARGET REACHED

Summary of the analysis

Additional analysis
Quotes
The WALT DISNEY CO. rating is 109.79 USD. The price registered an increase of +6.88% on the session and was traded between 109.40 USD and 114.81 USD over the period. The price is currently at +0.36% from its lowest and -4.37% from its highest.The Central Gaps scanner detects the formation of a bullish gap marking the strong presence of buyers against sellers at the opening. This formed a quotation gap.
Opening Gap UP
Type : Bullish
Timeframe : Openning
A study of price movements over other periods shows the following variations:
New HIGH record (1 month)
Type : Bullish
Timeframe : Weekly
Technical
Technical analysis of this Daily chart of WALT DISNEY CO. indicates that the overall trend is strongly bullish. 92.86% of the signals given by moving averages are bullish. The overall trend is supported by the strong bullish signals from short-term moving averages. The Central Indicators market scanner is currently detecting a bullish signal that could impact this trend:
Bullish trend reversal : Moving Average 100
Type : Bullish
Timeframe : Daily
In fact, 14 technical indicators on 18 studied are currently bullish. Caution: the Central Indicators scanner currently detects an excess:
RSI indicator is overbought : over 80
Type : Neutral
Timeframe : Daily
CCI indicator is overbought : over 100
Type : Neutral
Timeframe : Daily
Pivot points : price is over resistance 3
Type : Neutral
Timeframe : Weekly
An analysis of the price chart with the Central Patterns scanner (detector of chart patterns and resistances and supports) shows several results that can have an impact on the price change:
Horizontal resistance is broken
Type : Bullish
Timeframe : Daily
Resistance of channel is broken
Type : Bullish
Timeframe : Daily
The Central Candlesticks scanner, specialised in Japanese candlesticks, did not identify any signals.
| S3 | S2 | S1 | Price | R1 | R2 | R3 | |
|---|---|---|---|---|---|---|---|
| ProTrendLines | 95.05 | 102.16 | 107.15 | 109.79 | 113.47 | 122.26 | 149.62 |
| Change (%) | -13.43% | -6.95% | -2.40% | - | +3.35% | +11.36% | +36.28% |
| Change | -14.74 | -7.63 | -2.64 | - | +3.68 | +12.47 | +39.83 |
| Level | Major | Major | Minor | - | Major | Major | Minor |
Pivot points can also be used to set your price objectives. Here is the price situation in relation to pivot points:
| Pivot points | S3 | S2 | S1 | PP | R1 | R2 | R3 |
|---|---|---|---|---|---|---|---|
| Standard | 98.13 | 99.24 | 100.98 | 102.09 | 103.83 | 104.94 | 106.68 |
| Camarilla | 101.94 | 102.20 | 102.46 | 102.72 | 102.98 | 103.24 | 103.50 |
| Woodie | 98.45 | 99.40 | 101.30 | 102.25 | 104.15 | 105.10 | 107.00 |
| Fibonacci | 99.24 | 100.33 | 101.00 | 102.09 | 103.18 | 103.85 | 104.94 |
| Pivot points | S3 | S2 | S1 | PP | R1 | R2 | R3 |
|---|---|---|---|---|---|---|---|
| Standard | 91.66 | 93.35 | 96.18 | 97.87 | 100.70 | 102.39 | 105.22 |
| Camarilla | 97.78 | 98.19 | 98.61 | 99.02 | 99.43 | 99.85 | 100.26 |
| Woodie | 92.24 | 93.64 | 96.76 | 98.16 | 101.28 | 102.68 | 105.80 |
| Fibonacci | 93.35 | 95.07 | 96.14 | 97.87 | 99.59 | 100.66 | 102.39 |
| Pivot points | S3 | S2 | S1 | PP | R1 | R2 | R3 |
|---|---|---|---|---|---|---|---|
| Standard | 86.51 | 88.99 | 92.59 | 95.07 | 98.67 | 101.15 | 104.75 |
| Camarilla | 94.53 | 95.09 | 95.64 | 96.20 | 96.76 | 97.32 | 97.87 |
| Woodie | 87.08 | 89.27 | 93.16 | 95.35 | 99.24 | 101.43 | 105.32 |
| Fibonacci | 88.99 | 91.31 | 92.74 | 95.07 | 97.39 | 98.82 | 101.15 |
Numerical data
The following is the status of the technical indicators and moving averages at the time of publication of this technical analysis:
| RSI (14): | 85.77 | |
| MACD (12,26,9): | 2.5200 | |
| Directional Movement: | 47.93 | |
| AROON (14): | 64.29 | |
| DEMA (21): | 101.81 | |
| Parabolic SAR (0,02-0,02-0,2): | 96.30 | |
| Elder Ray (13): | 11.80 | |
| Super Trend (3,10): | 103.62 | |
| Zig ZAG (10): | 109.98 | |
| VORTEX (21): | 1.1600 | |
| Stochastique (14,3,5): | 87.93 | |
| TEMA (21): | 103.21 | |
| Williams %R (14): | -25.83 | |
| Chande Momentum Oscillator (20): | 13.44 | |
| Repulse (5,40,3): | -0.3600 | |
| ROCnROLL: | 1 | |
| TRIX (15,9): | 0.2200 | |
| Courbe Coppock: | 12.17 |
| MA7: | 101.59 | |
| MA20: | 98.03 | |
| MA50: | 95.04 | |
| MA100: | 93.75 | |
| MAexp7: | 102.47 | |
| MAexp20: | 98.90 | |
| MAexp50: | 96.25 | |
| MAexp100: | 95.93 | |
| Price / MA7: | +8.07% | |
| Price / MA20: | +12.00% | |
| Price / MA50: | +15.52% | |
| Price / MA100: | +17.11% | |
| Price / MAexp7: | +7.14% | |
| Price / MAexp20: | +11.01% | |
| Price / MAexp50: | +14.07% | |
| Price / MAexp100: | +14.45% |
News
The last news published on WALT DISNEY CO. at the time of the generation of this analysis was as follows:
- Reliance and Disney Announce Completion of Transaction to Form Joint Venture to Bring Together the Most Iconic and Engaging Entertainment Brands in India
- The Walt Disney Company Executives Share Commentary on Fiscal Full Year and Fourth Quarter 2024 Financial Results
- The Walt Disney Company Reports Fourth Quarter and Full Year Earnings for Fiscal 2024
- Hawaiian Airlines Welcomes Guests on an Exciting New Voyage with Walt Disney Animation Studios' "Moana 2"
- HBCU Week Foundation Announces 8th Annual HBCU Week in Wilmington, Delaware and 2nd HBCU Week College Fair at Walt Disney World Resort
About author
Online


Add a comment
Comments
0 comments on the analysis WALT DISNEY CO. - Daily