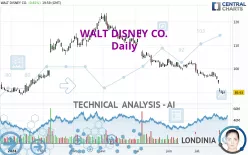
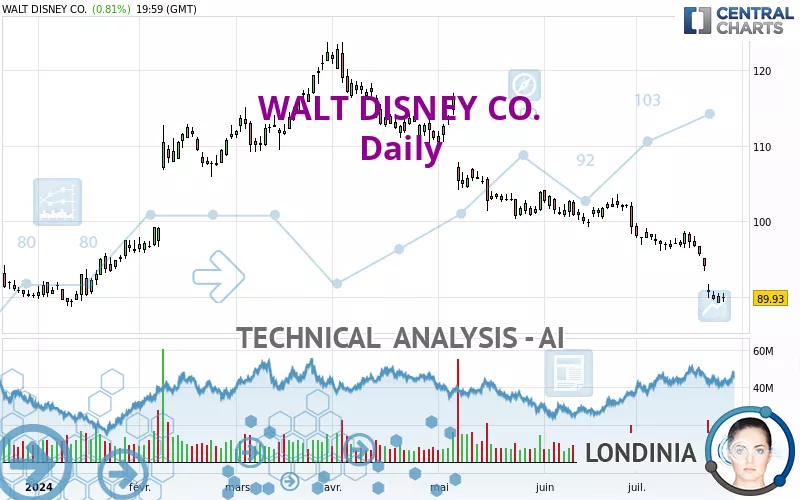
WALT DISNEY CO. - Daily - Technical analysis published on 07/27/2024 (GMT)
- 196
- 0
Click here for a new analysis!
- Timeframe : Daily
- - Analysis generated on
- Status : TARGET REACHED
Summary of the analysis

Additional analysis
Quotes
WALT DISNEY CO. rating 89.93 USD. The price has increased by +0.81% since the last closing with the lowest point at 89.33 USD and the highest point at 90.55 USD. The deviation from the price is +0.67% for the low point and -0.68% for the high point.The Central Gaps scanner detects a bullish opening marking the presence of buyers ahead of sellers at the opening but not sufficiently marked to allow the price to register a quotation gap.
Bullish opening
Type : Bullish
Timeframe : Openning
Here is a more detailed summary of the historical variations registered by WALT DISNEY CO.:
Near a new LOW record (1st january)
Type : Bearish
Timeframe : Weekly
Near a new LOW record (1 month)
Type : Bearish
Timeframe : Weekly
Technical
A technical analysis in Daily of this WALT DISNEY CO. chart shows a sharp bearish trend. 92.86% of the signals given by moving averages are bearish. This strongly bearish trend is supported by the strong bearish signals given by short-term moving averages. There is no crossing of moving average by the price or crossing of moving averages between themselves.
An assessment of technical indicators shows a bearish signal.
Caution: the Central Indicators scanner currently detects an excess:
CCI indicator is oversold : under -100
Type : Neutral
Timeframe : Daily
Previous candle closed under Bollinger bands
Type : Neutral
Timeframe : Daily
Williams %R indicator is oversold : under -80
Type : Neutral
Timeframe : Daily
Pivot points : price is under support 3
Type : Neutral
Timeframe : Weekly
Central Patterns, the market scanner focusing on chart patterns, resistances and supports found this result:
Near horizontal support
Type : Bullish
Timeframe : Daily
The Central Candlesticks scanner, specialised in Japanese candlesticks, did not identify any signals.
| S3 | S2 | S1 | Price | R1 | R2 | R3 | |
|---|---|---|---|---|---|---|---|
| ProTrendLines | 78.71 | 84.92 | 88.88 | 89.93 | 96.65 | 102.16 | 113.02 |
| Change (%) | -12.48% | -5.57% | -1.17% | - | +7.47% | +13.60% | +25.68% |
| Change | -11.22 | -5.01 | -1.05 | - | +6.72 | +12.23 | +23.09 |
| Level | Minor | Major | Major | - | Major | Intermediate | Major |
To determine price objectives, it is also possible to use the pivot points. Here is the price position in relation to pivot points:
| Pivot points | S3 | S2 | S1 | PP | R1 | R2 | R3 |
|---|---|---|---|---|---|---|---|
| Standard | 88.10 | 88.72 | 89.32 | 89.94 | 90.54 | 91.16 | 91.76 |
| Camarilla | 89.60 | 89.71 | 89.82 | 89.93 | 90.04 | 90.15 | 90.27 |
| Woodie | 88.10 | 88.72 | 89.32 | 89.94 | 90.54 | 91.16 | 91.76 |
| Fibonacci | 88.72 | 89.18 | 89.47 | 89.94 | 90.40 | 90.69 | 91.16 |
| Pivot points | S3 | S2 | S1 | PP | R1 | R2 | R3 |
|---|---|---|---|---|---|---|---|
| Standard | 81.77 | 85.49 | 87.71 | 91.43 | 93.65 | 97.37 | 99.59 |
| Camarilla | 88.30 | 88.84 | 89.39 | 89.93 | 90.48 | 91.02 | 91.56 |
| Woodie | 81.02 | 85.12 | 86.96 | 91.06 | 92.90 | 97.00 | 98.84 |
| Fibonacci | 85.49 | 87.76 | 89.16 | 91.43 | 93.70 | 95.10 | 97.37 |
| Pivot points | S3 | S2 | S1 | PP | R1 | R2 | R3 |
|---|---|---|---|---|---|---|---|
| Standard | 90.78 | 94.36 | 96.59 | 100.17 | 102.40 | 105.98 | 108.21 |
| Camarilla | 97.23 | 97.77 | 98.30 | 98.83 | 99.36 | 99.90 | 100.43 |
| Woodie | 90.12 | 94.02 | 95.93 | 99.83 | 101.74 | 105.64 | 107.55 |
| Fibonacci | 94.36 | 96.58 | 97.95 | 100.17 | 102.39 | 103.76 | 105.98 |
Numerical data
The following are the details of the technical indicators and moving averages that were collected to generate this technical analysis:
| RSI (14): | 23.38 | |
| MACD (12,26,9): | -2.7000 | |
| Directional Movement: | -25.80 | |
| AROON (14): | -50.00 | |
| DEMA (21): | 91.90 | |
| Parabolic SAR (0,02-0,02-0,2): | 94.48 | |
| Elder Ray (13): | -3.80 | |
| Super Trend (3,10): | 95.06 | |
| Zig ZAG (10): | 89.93 | |
| VORTEX (21): | 0.6700 | |
| Stochastique (14,3,5): | 3.34 | |
| TEMA (21): | 90.87 | |
| Williams %R (14): | -92.43 | |
| Chande Momentum Oscillator (20): | -7.04 | |
| Repulse (5,40,3): | -1.8700 | |
| ROCnROLL: | 2 | |
| TRIX (15,9): | -0.2800 | |
| Courbe Coppock: | 11.61 |
| MA7: | 92.36 | |
| MA20: | 95.70 | |
| MA50: | 99.20 | |
| MA100: | 106.21 | |
| MAexp7: | 91.88 | |
| MAexp20: | 95.19 | |
| MAexp50: | 99.15 | |
| MAexp100: | 101.22 | |
| Price / MA7: | -2.63% | |
| Price / MA20: | -6.03% | |
| Price / MA50: | -9.34% | |
| Price / MA100: | -15.33% | |
| Price / MAexp7: | -2.12% | |
| Price / MAexp20: | -5.53% | |
| Price / MAexp50: | -9.30% | |
| Price / MAexp100: | -11.15% |
News
Don't forget to follow the news on WALT DISNEY CO.. At the time of publication of this analysis, the latest news was as follows:
- The Walt Disney Company Kicks Off Global Celebration Honoring 90 Years of Donald Duck
- JLL arranges $735M refinancing for the Walt Disney World Swan & Dolphin Resort on behalf of Tishman Hotel & Realty and MetLife Investment Management
- Thinking about trading options or stock in Cloudflare, Walt Disney, Ford Motor, Synopsys, or Marathon Digital?
- Thinking about trading options or stock in Estee Lauder, Apple, Arista Networks, Walt Disney, or SpringWorks Therapeutics?
-
 Look ahead: RBA; China inflation; eurozone retail; Vodafone; UBS; Walt Disney; Uber
About author

Online


Add a comment
Comments
0 comments on the analysis WALT DISNEY CO. - Daily