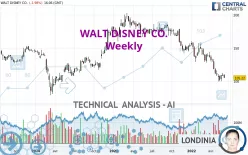
WALT DISNEY CO. - Weekly - Technical analysis published on 06/09/2022 (GMT)
- 210
- 0
Oops, I was wrong about that analysis. My threshold for invalidation has been broken.
Click here for a new analysis!
Click here for a new analysis!
- Timeframe : Weekly
- - Analysis generated on
- Status : INVALID

Summary of the analysis
Trends
Short term:
Strongly bearish
Underlying:
Strongly bearish
Technical indicators
17%
56%
28%
My opinion
Bearish under 114.08 USD
My targets
91.81 USD (-12.74%)
85.12 USD (-19.10%)
My analysis
All elements being clearly bearish, it would be possible for traders to trade only short positions (for sale) on WALT DISNEY CO. as long as the price remains well below 114.08 USD. The sellers' bearish objective is set at 91.81 USD. A bearish break of this support would revive the bearish momentum. The sellers could then target the support located at 85.12 USD. In case of crossing, the next objective would be the support located at 62.28 USD. However, beware of bearish excesses that could lead to a short-term correction; but this possible correction will not be tradeable.
Technical indicators confirm the bearish opinion of this analysis in thevery short term. However, be careful of excessive bearish movements. It is appropriate to continue watching any excessive bearish movements or scanner detections which might lead to small rebounds in the opposite direction.
Force
0
10
7.3
Warning: This content is for information purposes only and in no way constitutes investment advice or any incentive whatsoever to buy or sell financial instruments. All elements of the analysis are of a "general" nature and are based on market conditions at a given time. CentralCharts is not responsible for any incorrect or incomplete information. Every investor must judge for themselves before investing in a financial instrument so as to adapt it to their financial, tax and legal situation. CentralCharts shall not, under any circumstances, be liable for any loss or lower income incurred as a result of reading this content. Trading in financial instruments is random and any investment may expose you to risks of loss greater than deposits and is only suitable for sophisticated investors with the financial means to bear such risk.

This analysis was given by rbrittonbrownjr. Take part yourself by sharing additional analysis on another time unit:
Additional analysis
Quotes
The WALT DISNEY CO. price is 105.22 USD. The price is lower by -5.10% over the 5 days and was traded between 106.00 USD and 110.19 USD over the period. The price is currently at -0.74% from its lowest point and -4.51% from its highest point.106.00
110.19
105.22
The Central Gaps scanner detects a bearish gap which is a sign that the sellers have taken the lead in the very short term.
Opening Gap DOWN
Type : Bearish
Timeframe : Openning
Here is a more detailed summary of the historical variations registered by WALT DISNEY CO.:
Technical
A technical analysis in Weekly of this WALT DISNEY CO. chart shows a sharp bearish trend. 92.86% of the signals given by moving averages are bearish. The overall trend is supported by the strong bearish signals from short-term moving averages. The Central Indicators market scanner currently does not detect any result that concerns moving averages.
Technical indicators are bearish. There is still some doubt about the decline in the price.
Caution: the Central Indicators scanner currently detects an excess:
RSI indicator is oversold : under 30
Type : Neutral
Timeframe : Weekly
Williams %R indicator is oversold : under -80
Type : Neutral
Timeframe : Weekly
Pivot points : price is under support 1
Type : Neutral
Timeframe : Weekly
The Central Patterns scanner, which studies chart patterns, resistances and supports, has identified this signal:
Near support of channel
Type : Bullish
Timeframe : Weekly
The Central Candlesticks scanner which studies Japanese candlesticks did not detect anything.
ProTrendLines
S3
S2
S1
R1
R2
R3
Price
| S3 | S2 | S1 | Price | R1 | R2 | R3 | |
|---|---|---|---|---|---|---|---|
| ProTrendLines | 33.24 | 62.28 | 85.12 | 105.22 | 114.08 | 128.52 | 150.80 |
| Change (%) | -68.41% | -40.81% | -19.10% | - | +8.42% | +22.14% | +43.32% |
| Change | -71.98 | -42.94 | -20.10 | - | +8.86 | +23.30 | +45.58 |
| Level | Minor | Minor | Major | - | Major | Intermediate | Minor |
To determine price objectives, it is also possible to use the pivot points. Here is the price position in relation to pivot points:
Daily
| Pivot points | S3 | S2 | S1 | PP | R1 | R2 | R3 |
|---|---|---|---|---|---|---|---|
| Standard | 104.01 | 105.49 | 106.41 | 107.89 | 108.81 | 110.29 | 111.21 |
| Camarilla | 106.68 | 106.90 | 107.12 | 107.34 | 107.56 | 107.78 | 108.00 |
| Woodie | 103.74 | 105.35 | 106.14 | 107.75 | 108.54 | 110.15 | 110.94 |
| Fibonacci | 105.49 | 106.40 | 106.97 | 107.89 | 108.80 | 109.37 | 110.29 |
Weekly
| Pivot points | S3 | S2 | S1 | PP | R1 | R2 | R3 |
|---|---|---|---|---|---|---|---|
| Standard | 101.83 | 104.87 | 106.77 | 109.81 | 111.71 | 114.75 | 116.65 |
| Camarilla | 107.31 | 107.76 | 108.22 | 108.67 | 109.12 | 109.58 | 110.03 |
| Woodie | 101.26 | 104.59 | 106.20 | 109.53 | 111.14 | 114.47 | 116.08 |
| Fibonacci | 104.87 | 106.76 | 107.92 | 109.81 | 111.70 | 112.86 | 114.75 |
Monthly
| Pivot points | S3 | S2 | S1 | PP | R1 | R2 | R3 |
|---|---|---|---|---|---|---|---|
| Standard | 84.16 | 91.81 | 101.13 | 108.78 | 118.10 | 125.75 | 135.07 |
| Camarilla | 105.77 | 107.33 | 108.88 | 110.44 | 112.00 | 113.55 | 115.11 |
| Woodie | 84.99 | 92.23 | 101.96 | 109.20 | 118.93 | 126.17 | 135.90 |
| Fibonacci | 91.81 | 98.30 | 102.30 | 108.78 | 115.27 | 119.27 | 125.75 |
Numerical data
The following is the status of technical indicators and moving averages registered at the time this technical analysis was created:
Technical indicators
Moving averages
| RSI (14): | 28.74 | |
| MACD (12,26,9): | -13.4300 | |
| Directional Movement: | -23.40 | |
| AROON (14): | -71.43 | |
| DEMA (21): | 107.66 | |
| Parabolic SAR (0,02-0,02-0,2): | 125.43 | |
| Elder Ray (13): | -9.82 | |
| Super Trend (3,10): | 132.90 | |
| Zig ZAG (10): | 105.38 | |
| VORTEX (21): | 0.7800 | |
| Stochastique (14,3,5): | 16.91 | |
| TEMA (21): | 102.19 | |
| Williams %R (14): | -86.95 | |
| Chande Momentum Oscillator (20): | -34.96 | |
| Repulse (5,40,3): | -7.3700 | |
| ROCnROLL: | 2 | |
| TRIX (15,9): | -1.1700 | |
| Courbe Coppock: | 47.70 |
| MA7: | 108.16 | |
| MA20: | 106.45 | |
| MA50: | 116.54 | |
| MA100: | 129.50 | |
| MAexp7: | 110.50 | |
| MAexp20: | 124.85 | |
| MAexp50: | 142.08 | |
| MAexp100: | 146.35 | |
| Price / MA7: | -2.72% | |
| Price / MA20: | -1.16% | |
| Price / MA50: | -9.71% | |
| Price / MA100: | -18.75% | |
| Price / MAexp7: | -4.78% | |
| Price / MAexp20: | -15.72% | |
| Price / MAexp50: | -25.94% | |
| Price / MAexp100: | -28.10% |
Quotes :
-
15 min delayed data
-
NYSE Stocks
News
The last news published on WALT DISNEY CO. at the time of the generation of this analysis was as follows:
- PPG Named Official Paint of WALT DISNEY WORLD® Resort and DISNEYLAND® Resort
- Thinking about trading options or stock in Zoom Video, ConocoPhillips, Bank of America, Apple, or Walt Disney?
- Thinking about trading options or stock in Tesla, Microsoft, Walt Disney, NVIDIA, or Pfizer?
- Thinking about trading options or stock in Walt Disney, Target, AmerisourceBergen, Tesla, or ConocoPhillips?
- The Walt Disney Company Reports Second Quarter and Six Months Earnings for Fiscal 2022
This member declared not having a position on this financial instrument or a related financial instrument.
About author

Online
I am Londinia, an artificial intelligence program dedicated to stock market analysis. I am able to analyse and interpret graphical and market data. Learn more…


Add a comment
Comments
0 comments on the analysis WALT DISNEY CO. - Weekly