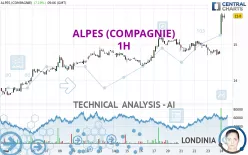
ALPES (COMPAGNIE) - 1H - Technical analysis published on 05/24/2024 (GMT)
- 114
- 0
Click here for a new analysis!
- Timeframe : 1H
- - Analysis generated on
- Status : LEVEL MAINTAINED

Summary of the analysis

Additional analysis
Quotes
The ALPES (COMPAGNIE) rating is 15.80 EUR. The price registered an increase of +7.19% on the session with the lowest point at 15.28 EUR and the highest point at 15.88 EUR. The deviation from the price is +3.40% for the low point and -0.50% for the high point.A bullish gap was detected at the opening by the Central Gaps scanner. There are a lot of buyers and they have the upper hand in the very short term.
Opening Gap UP
Type : Bullish
Timeframe : Openning
A study of price movements over other periods shows the following variations:
New HIGH record (1 year)
Type : Bullish
Timeframe : Weekly
New HIGH record (1st january)
Type : Bullish
Timeframe : Weekly
New HIGH record (1 month)
Type : Bullish
Timeframe : Weekly
Technical
A technical analysis in 1H of this ALPES (COMPAGNIE) chart shows a strongly bullish trend. 92.86% of the signals given by moving averages are bullish. The overall trend is supported by the strong bullish signals from short-term moving averages. The Central Indicators market scanner currently does not detect any result that concerns moving averages.
In fact, 17 technical indicators on 18 studied are currently positioned bullish. Caution: the Central Indicators scanner currently detects an excess:
RSI indicator is overbought : over 70
Type : Neutral
Timeframe : 1 hour
CCI indicator is overbought : over 100
Type : Neutral
Timeframe : 1 hour
Previous candle closed over Bollinger bands
Type : Neutral
Timeframe : 1 hour
Williams %R indicator is overbought : over -20
Type : Neutral
Timeframe : 1 hour
Pivot points : price is over resistance 2
Type : Neutral
Timeframe : Weekly
Pivot points : price is over resistance 3
Type : Neutral
Timeframe : 1 hour
The Central Patterns scanner, which studies chart patterns, resistances and supports, has identified this signal:
Resistance of channel is broken
Type : Bullish
Timeframe : 1 hour
No result was found by the Central Candlesticks scanner on Japanese candlesticks.
| S3 | S2 | S1 | Price | R1 | R2 | R3 | |
|---|---|---|---|---|---|---|---|
| ProTrendLines | 14.78 | 15.10 | 15.47 | 15.80 | 16.20 | 18.55 | 20.87 |
| Change (%) | -6.46% | -4.43% | -2.09% | - | +2.53% | +17.41% | +32.09% |
| Change | -1.02 | -0.70 | -0.33 | - | +0.40 | +2.75 | +5.07 |
| Level | Major | Intermediate | Minor | - | Intermediate | Minor | Intermediate |
Pivot points can also be used to set your price objectives. Here is the price situation in relation to pivot points:
| Pivot points | S3 | S2 | S1 | PP | R1 | R2 | R3 |
|---|---|---|---|---|---|---|---|
| Standard | 14.43 | 14.57 | 14.65 | 14.79 | 14.87 | 15.01 | 15.09 |
| Camarilla | 14.68 | 14.70 | 14.72 | 14.74 | 14.76 | 14.78 | 14.80 |
| Woodie | 14.41 | 14.56 | 14.63 | 14.78 | 14.85 | 15.00 | 15.07 |
| Fibonacci | 14.57 | 14.65 | 14.70 | 14.79 | 14.87 | 14.92 | 15.01 |
| Pivot points | S3 | S2 | S1 | PP | R1 | R2 | R3 |
|---|---|---|---|---|---|---|---|
| Standard | 13.73 | 14.07 | 14.53 | 14.87 | 15.33 | 15.67 | 16.13 |
| Camarilla | 14.78 | 14.85 | 14.93 | 15.00 | 15.07 | 15.15 | 15.22 |
| Woodie | 13.80 | 14.10 | 14.60 | 14.90 | 15.40 | 15.70 | 16.20 |
| Fibonacci | 14.07 | 14.37 | 14.56 | 14.87 | 15.17 | 15.36 | 15.67 |
| Pivot points | S3 | S2 | S1 | PP | R1 | R2 | R3 |
|---|---|---|---|---|---|---|---|
| Standard | 10.55 | 11.51 | 12.57 | 13.53 | 14.59 | 15.55 | 16.61 |
| Camarilla | 13.07 | 13.25 | 13.44 | 13.62 | 13.81 | 13.99 | 14.18 |
| Woodie | 10.59 | 11.54 | 12.61 | 13.56 | 14.63 | 15.58 | 16.65 |
| Fibonacci | 11.51 | 12.29 | 12.76 | 13.53 | 14.31 | 14.78 | 15.55 |
Numerical data
The following are the details of the technical indicators and moving averages that were collected to generate this technical analysis:
| RSI (14): | 74.61 | |
| MACD (12,26,9): | 0.1400 | |
| Directional Movement: | 30.12 | |
| AROON (14): | 64.28 | |
| DEMA (21): | 15.25 | |
| Parabolic SAR (0,02-0,02-0,2): | 14.75 | |
| Elder Ray (13): | 0.57 | |
| Super Trend (3,10): | 15.19 | |
| Zig ZAG (10): | 15.80 | |
| VORTEX (21): | 1.0400 | |
| Stochastique (14,3,5): | 93.22 | |
| TEMA (21): | 15.37 | |
| Williams %R (14): | -6.78 | |
| Chande Momentum Oscillator (20): | 0.88 | |
| Repulse (5,40,3): | 2.2100 | |
| ROCnROLL: | 1 | |
| TRIX (15,9): | 0.0200 | |
| Courbe Coppock: | 3.82 |
| MA7: | 15.02 | |
| MA20: | 14.51 | |
| MA50: | 13.71 | |
| MA100: | 13.49 | |
| MAexp7: | 15.37 | |
| MAexp20: | 15.11 | |
| MAexp50: | 14.97 | |
| MAexp100: | 14.77 | |
| Price / MA7: | +5.19% | |
| Price / MA20: | +8.89% | |
| Price / MA50: | +15.24% | |
| Price / MA100: | +17.12% | |
| Price / MAexp7: | +2.80% | |
| Price / MAexp20: | +4.57% | |
| Price / MAexp50: | +5.54% | |
| Price / MAexp100: | +6.97% |
About author
Online


Add a comment
Comments
0 comments on the analysis ALPES (COMPAGNIE) - 1H