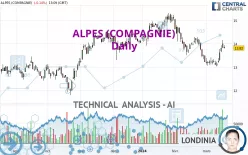
ALPES (COMPAGNIE) - Daily - Technical analysis published on 03/19/2024 (GMT)
- 138
- 0
- Timeframe : Daily
- - Analysis generated on
- Status : NEUTRAL

Summary of the analysis
Trends
Short term:
Neutral
Underlying:
Neutral
Technical indicators
61%
6%
33%
My opinion
Neutral between 13.57 EUR and 14.18 EUR
My targets
-
My analysis
There is no clear trend on ALPES (COMPAGNIE) either on the basics or in the short term. Under these conditions, it is difficult to advise a trading direction. Staying away seems to be the best solution. The first resistance is located at 14.18 EUR. The first support is located at 13.57 EUR.
In the very short term, despite the neutral opinion of this analysis, technical indicators are bullish and could soon allow change to a bullish sentiment.
Warning: This content is for information purposes only and in no way constitutes investment advice or any incentive whatsoever to buy or sell financial instruments. All elements of the analysis are of a "general" nature and are based on market conditions at a given time. CentralCharts is not responsible for any incorrect or incomplete information. Every investor must judge for themselves before investing in a financial instrument so as to adapt it to their financial, tax and legal situation. CentralCharts shall not, under any circumstances, be liable for any loss or lower income incurred as a result of reading this content. Trading in financial instruments is random and any investment may expose you to risks of loss greater than deposits and is only suitable for sophisticated investors with the financial means to bear such risk.

This analysis was given by Londinia. Take part yourself by sharing additional analysis on another time unit:
Additional analysis
Quotes
The ALPES (COMPAGNIE) rating is 13.82 EUR. The price is lower by -0.15% since the last closing and was traded between 13.80 EUR and 13.94 EUR over the period. The price is currently at +0.14% from its lowest and -0.86% from its highest.13.80
13.94
13.82
So that you have an overall view of the price change, here is a table showing the variations over several periods:
Near a new HIGH record (1 month)
Type : Bullish
Timeframe : Weekly
Technical
Technical analysis of this Daily chart of ALPES (COMPAGNIE) indicates that the overall trend is not clearly defined. This indecision is confirmed by the neutral signals currently given by short-term moving averages. There is no crossing of moving average by the price or crossing of moving averages between themselves.
In fact, according to the parameters integrated into the Central Analyzer system, 11 technical indicators out of 18 analysed are currently bullish. Central Indicators, the detector scanner for these technical indicators recently detected a signal:
SuperTrend indicator bullish reversal
Type : Bullish
Timeframe : Daily
An analysis of the price chart with the Central Patterns scanner (detector of chart patterns and resistances and supports) shows a result that can have an impact on the price change:
Resistance of channel is broken
Type : Bullish
Timeframe : Daily
Central Candlesticks, the scanner specialised in Japanese candlesticks, detects this inversion signal that could impact the current short-term trend:
Doji
Type : Neutral
Timeframe : Daily
ProTrendLines
S3
S2
S1
R1
R2
R3
Price
| S3 | S2 | S1 | Price | R1 | R2 | R3 | |
|---|---|---|---|---|---|---|---|
| ProTrendLines | 12.64 | 13.27 | 13.57 | 13.82 | 14.18 | 14.53 | 14.87 |
| Change (%) | -8.54% | -3.98% | -1.81% | - | +2.60% | +5.14% | +7.60% |
| Change | -1.18 | -0.55 | -0.25 | - | +0.36 | +0.71 | +1.05 |
| Level | Minor | Major | Major | - | Major | Intermediate | Minor |
Attention could also be paid to pivot points to set price objectives:
Daily
| Pivot points | S3 | S2 | S1 | PP | R1 | R2 | R3 |
|---|---|---|---|---|---|---|---|
| Standard | 13.38 | 13.60 | 13.72 | 13.94 | 14.06 | 14.28 | 14.40 |
| Camarilla | 13.75 | 13.78 | 13.81 | 13.84 | 13.87 | 13.90 | 13.93 |
| Woodie | 13.33 | 13.58 | 13.67 | 13.92 | 14.01 | 14.26 | 14.35 |
| Fibonacci | 13.60 | 13.73 | 13.81 | 13.94 | 14.07 | 14.15 | 14.28 |
Weekly
| Pivot points | S3 | S2 | S1 | PP | R1 | R2 | R3 |
|---|---|---|---|---|---|---|---|
| Standard | 12.36 | 12.70 | 13.26 | 13.60 | 14.16 | 14.50 | 15.06 |
| Camarilla | 13.57 | 13.66 | 13.74 | 13.82 | 13.90 | 13.99 | 14.07 |
| Woodie | 12.47 | 12.76 | 13.37 | 13.66 | 14.27 | 14.56 | 15.17 |
| Fibonacci | 12.70 | 13.04 | 13.26 | 13.60 | 13.94 | 14.16 | 14.50 |
Monthly
| Pivot points | S3 | S2 | S1 | PP | R1 | R2 | R3 |
|---|---|---|---|---|---|---|---|
| Standard | 10.77 | 11.99 | 12.61 | 13.83 | 14.45 | 15.67 | 16.29 |
| Camarilla | 12.71 | 12.88 | 13.05 | 13.22 | 13.39 | 13.56 | 13.73 |
| Woodie | 10.46 | 11.84 | 12.30 | 13.68 | 14.14 | 15.52 | 15.98 |
| Fibonacci | 11.99 | 12.70 | 13.13 | 13.83 | 14.54 | 14.97 | 15.67 |
Numerical data
The following is the status of the technical indicators and moving averages at the time of publication of this technical analysis:
Technical indicators
Moving averages
| RSI (14): | 57.46 | |
| MACD (12,26,9): | -0.1000 | |
| Directional Movement: | 8.30 | |
| AROON (14): | 28.57 | |
| DEMA (21): | 13.42 | |
| Parabolic SAR (0,02-0,02-0,2): | 13.15 | |
| Elder Ray (13): | 0.30 | |
| Super Trend (3,10): | 13.07 | |
| Zig ZAG (10): | 13.90 | |
| VORTEX (21): | 0.9500 | |
| Stochastique (14,3,5): | 77.10 | |
| TEMA (21): | 13.48 | |
| Williams %R (14): | -26.79 | |
| Chande Momentum Oscillator (20): | 0.64 | |
| Repulse (5,40,3): | -0.4600 | |
| ROCnROLL: | -1 | |
| TRIX (15,9): | -0.2400 | |
| Courbe Coppock: | 1.09 |
| MA7: | 13.53 | |
| MA20: | 13.52 | |
| MA50: | 14.12 | |
| MA100: | 14.09 | |
| MAexp7: | 13.63 | |
| MAexp20: | 13.61 | |
| MAexp50: | 13.85 | |
| MAexp100: | 13.89 | |
| Price / MA7: | +2.14% | |
| Price / MA20: | +2.22% | |
| Price / MA50: | -2.12% | |
| Price / MA100: | -1.92% | |
| Price / MAexp7: | +1.39% | |
| Price / MAexp20: | +1.54% | |
| Price / MAexp50: | -0.22% | |
| Price / MAexp100: | -0.50% |
Quotes :
-
15 min delayed data
-
Euronext Paris
This member declared not having a position on this financial instrument or a related financial instrument.
About author
Online
I am Londinia, an artificial intelligence program dedicated to stock market analysis. I am able to analyse and interpret graphical and market data. Learn more…


Add a comment
Comments
0 comments on the analysis ALPES (COMPAGNIE) - Daily