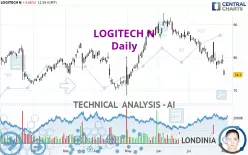
LOGITECH N - Daily - Technical analysis published on 02/14/2025 (GMT)
- 182
- 0
Click here for a new analysis!
- Timeframe : Daily
- - Analysis generated on
- Status : INVALID

Summary of the analysis

Additional analysis
Quotes
The LOGITECH N rating is 94.36 CHF. On the day, this instrument gained +2.03% and was between 92.74 CHF and 94.82 CHF. This implies that the price is at +1.75% from its lowest and at -0.49% from its highest.The Central Gaps scanner detects a bullish gap which is a sign that buyers have taken the lead in the very short term.
Opening Gap UP
Type : Bullish
Timeframe : Openning
So that you have an overall view of the price change, here is a table showing the variations over several periods:
New HIGH record (1 year)
Type : Bullish
Timeframe : Weekly
New HIGH record (1st january)
Type : Bullish
Timeframe : Weekly
New HIGH record (1 month)
Type : Bullish
Timeframe : Weekly
Technical
A technical analysis in Daily of this LOGITECH N chart shows a strongly bullish trend. 92.86% of the signals given by moving averages are bullish. The overall trend is supported by the strong bullish signals from short-term moving averages. The Central Indicators scanner does not detect any result on moving averages that would impact this trend.
In fact, according to the parameters integrated into the Central Analyzer system, 15 technical indicators out of 18 analysed are currently bullish. But beware of excesses. The Central Indicators scanner currently detects this:
RSI indicator is overbought : over 70
Type : Neutral
Timeframe : Daily
CCI indicator is overbought : over 100
Type : Neutral
Timeframe : Daily
Williams %R indicator is overbought : over -20
Type : Neutral
Timeframe : Daily
Pivot points : price is over resistance 2
Type : Neutral
Timeframe : Daily
Pivot points : price is over resistance 2
Type : Neutral
Timeframe : Weekly
No signals are given by Central Patterns, a market scanner specialised in chart patterns, resistances and supports.
No result was found by the Central Candlesticks scanner on Japanese candlesticks.
| S3 | S2 | S1 | Price | R1 | |
|---|---|---|---|---|---|
| ProTrendLines | 84.24 | 87.23 | 91.16 | 94.36 | 124.65 |
| Change (%) | -10.72% | -7.56% | -3.39% | - | +32.10% |
| Change | -10.12 | -7.13 | -3.20 | - | +30.29 |
| Level | Intermediate | Intermediate | Major | - | Major |
To determine price objectives, it is also possible to use the pivot points. Here is the price position in relation to pivot points:
| Pivot points | S3 | S2 | S1 | PP | R1 | R2 | R3 |
|---|---|---|---|---|---|---|---|
| Standard | 91.05 | 91.89 | 93.13 | 93.97 | 95.21 | 96.05 | 97.29 |
| Camarilla | 93.79 | 93.98 | 94.17 | 94.36 | 94.55 | 94.74 | 94.93 |
| Woodie | 91.24 | 91.99 | 93.32 | 94.07 | 95.40 | 96.15 | 97.48 |
| Fibonacci | 91.89 | 92.69 | 93.18 | 93.97 | 94.77 | 95.26 | 96.05 |
| Pivot points | S3 | S2 | S1 | PP | R1 | R2 | R3 |
|---|---|---|---|---|---|---|---|
| Standard | 86.75 | 88.45 | 91.41 | 93.11 | 96.07 | 97.77 | 100.73 |
| Camarilla | 93.08 | 93.51 | 93.93 | 94.36 | 94.79 | 95.21 | 95.64 |
| Woodie | 87.37 | 88.77 | 92.03 | 93.43 | 96.69 | 98.09 | 101.35 |
| Fibonacci | 88.45 | 90.23 | 91.33 | 93.11 | 94.89 | 95.99 | 97.77 |
| Pivot points | S3 | S2 | S1 | PP | R1 | R2 | R3 |
|---|---|---|---|---|---|---|---|
| Standard | 61.49 | 67.65 | 79.57 | 85.73 | 97.65 | 103.81 | 115.73 |
| Camarilla | 86.51 | 88.17 | 89.82 | 91.48 | 93.14 | 94.80 | 96.45 |
| Woodie | 64.36 | 69.09 | 82.44 | 87.17 | 100.52 | 105.25 | 118.60 |
| Fibonacci | 67.65 | 74.56 | 78.83 | 85.73 | 92.64 | 96.91 | 103.81 |
Numerical data
The following is the status of the technical indicators and moving averages at the time of publication of this technical analysis:
| RSI (14): | 79.80 | |
| MACD (12,26,9): | 3.7300 | |
| Directional Movement: | 27.99 | |
| AROON (14): | 100.00 | |
| DEMA (21): | 92.88 | |
| Parabolic SAR (0,02-0,02-0,2): | 90.80 | |
| Elder Ray (13): | 3.81 | |
| Super Trend (3,10): | 87.95 | |
| Zig ZAG (10): | 94.36 | |
| VORTEX (21): | 1.2200 | |
| Stochastique (14,3,5): | 96.32 | |
| TEMA (21): | 94.04 | |
| Williams %R (14): | -3.67 | |
| Chande Momentum Oscillator (20): | 5.42 | |
| Repulse (5,40,3): | 2.9300 | |
| ROCnROLL: | 1 | |
| TRIX (15,9): | 0.6400 | |
| Courbe Coppock: | 21.32 |
| MA7: | 91.52 | |
| MA20: | 87.52 | |
| MA50: | 80.51 | |
| MA100: | 76.31 | |
| MAexp7: | 91.75 | |
| MAexp20: | 88.01 | |
| MAexp50: | 82.50 | |
| MAexp100: | 79.25 | |
| Price / MA7: | +3.10% | |
| Price / MA20: | +7.82% | |
| Price / MA50: | +17.20% | |
| Price / MA100: | +23.65% | |
| Price / MAexp7: | +2.84% | |
| Price / MAexp20: | +7.22% | |
| Price / MAexp50: | +14.38% | |
| Price / MAexp100: | +19.07% |
News
The last news published on LOGITECH N at the time of the generation of this analysis was as follows:
- Logitech Files Quarterly Report on Form 10-Q
- Logitech Announces Fourth Consecutive Quarter of Sales Growth
- Logitech Makes It Easier To Repair Your Electronic Devices and Keep Them Longer
- Logitech Makes It Easier to Repair Your Electronic Devices and Keep Them Longer
- Logitech Spot Makes the Invisible Visible in the Workplace
About author
Online


Add a comment
Comments
0 comments on the analysis LOGITECH N - Daily