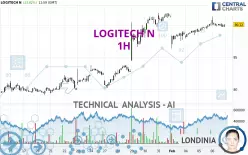
LOGITECH N - 1H - Technical analysis published on 02/06/2025 (GMT)
- 134
- 0
Click here for a new analysis!
- Timeframe : 1H
- - Analysis generated on
- Status : TARGET REACHED

Summary of the analysis

Additional analysis
Quotes
The LOGITECH N rating is 90.12 CHF. On the day, this instrument lost -0.13% and was between 89.72 CHF and 91.36 CHF. This implies that the price is at +0.45% from its lowest and at -1.36% from its highest.A study of price movements over other periods shows the following variations:
Near a new HIGH record (1 year)
Type : Bullish
Timeframe : Weekly
Near a new HIGH record (1st january)
Type : Bullish
Timeframe : Weekly
Near a new HIGH record (1 month)
Type : Bullish
Timeframe : Weekly
Technical
Technical analysis of LOGITECH N in 1H shows a strongly overall bullish trend. The signals given by the moving averages are 85.71% bullish. This strong bullish trend is confirmed by the strong signals currently being given by short-term moving averages. The Central Indicators market scanner is currently detecting several bullish signals that could impact this trend:
Moving Average bullish crossovers : MA20 & MA50
Type : Bullish
Timeframe : 1 hour
Bullish price crossover with Moving Average 50
Type : Bullish
Timeframe : 1 hour
Bullish price crossover with adaptative moving average 20
Type : Bullish
Timeframe : 1 hour
An assessment of technical indicators shows a slightly bullish signal.
Central Indicators, the scanner specialised in technical indicators, has identified these signals:
Price is back over the pivot point
Type : Bullish
Timeframe : 1 hour
Price is back over the pivot point
Type : Bullish
Timeframe : Weekly
No signals are given by Central Patterns, a market scanner specialised in chart patterns, resistances and supports.
The Central Candlesticks scanner which studies Japanese candlesticks did not detect anything.
| S3 | S2 | S1 | Price | R1 | R2 | R3 | |
|---|---|---|---|---|---|---|---|
| ProTrendLines | 81.32 | 87.29 | 89.08 | 90.12 | 91.16 | 106.35 | 124.65 |
| Change (%) | -9.76% | -3.14% | -1.15% | - | +1.15% | +18.01% | +38.32% |
| Change | -8.80 | -2.83 | -1.04 | - | +1.04 | +16.23 | +34.53 |
| Level | Intermediate | Intermediate | Minor | - | Major | Minor | Major |
Pivot points can also be used to set your price objectives. Here is the price situation in relation to pivot points:
| Pivot points | S3 | S2 | S1 | PP | R1 | R2 | R3 |
|---|---|---|---|---|---|---|---|
| Standard | 88.07 | 88.51 | 89.37 | 89.81 | 90.67 | 91.11 | 91.97 |
| Camarilla | 89.88 | 90.00 | 90.12 | 90.24 | 90.36 | 90.48 | 90.60 |
| Woodie | 88.29 | 88.62 | 89.59 | 89.92 | 90.89 | 91.22 | 92.19 |
| Fibonacci | 88.51 | 89.00 | 89.31 | 89.81 | 90.30 | 90.61 | 91.11 |
| Pivot points | S3 | S2 | S1 | PP | R1 | R2 | R3 |
|---|---|---|---|---|---|---|---|
| Standard | 72.09 | 76.13 | 83.81 | 87.85 | 95.53 | 99.57 | 107.25 |
| Camarilla | 88.26 | 89.33 | 90.41 | 91.48 | 92.55 | 93.63 | 94.70 |
| Woodie | 73.90 | 77.04 | 85.62 | 88.76 | 97.34 | 100.48 | 109.06 |
| Fibonacci | 76.13 | 80.61 | 83.38 | 87.85 | 92.33 | 95.10 | 99.57 |
| Pivot points | S3 | S2 | S1 | PP | R1 | R2 | R3 |
|---|---|---|---|---|---|---|---|
| Standard | 61.49 | 67.65 | 79.57 | 85.73 | 97.65 | 103.81 | 115.73 |
| Camarilla | 86.51 | 88.17 | 89.82 | 91.48 | 93.14 | 94.80 | 96.45 |
| Woodie | 64.36 | 69.09 | 82.44 | 87.17 | 100.52 | 105.25 | 118.60 |
| Fibonacci | 67.65 | 74.56 | 78.83 | 85.73 | 92.64 | 96.91 | 103.81 |
Numerical data
The following is the status of technical indicators and moving averages registered at the time this technical analysis was created:
| RSI (14): | 57.97 | |
| MACD (12,26,9): | 0.2300 | |
| Directional Movement: | 7.23 | |
| AROON (14): | 28.57 | |
| DEMA (21): | 90.13 | |
| Parabolic SAR (0,02-0,02-0,2): | 89.01 | |
| Elder Ray (13): | 0.02 | |
| Super Trend (3,10): | 90.90 | |
| Zig ZAG (10): | 90.12 | |
| VORTEX (21): | 1.0800 | |
| Stochastique (14,3,5): | 30.20 | |
| TEMA (21): | 90.08 | |
| Williams %R (14): | -62.63 | |
| Chande Momentum Oscillator (20): | 0.34 | |
| Repulse (5,40,3): | 0.0400 | |
| ROCnROLL: | 1 | |
| TRIX (15,9): | 0.0400 | |
| Courbe Coppock: | 1.24 |
| MA7: | 89.87 | |
| MA20: | 83.77 | |
| MA50: | 78.03 | |
| MA100: | 75.17 | |
| MAexp7: | 90.00 | |
| MAexp20: | 89.81 | |
| MAexp50: | 89.04 | |
| MAexp100: | 87.12 | |
| Price / MA7: | +0.28% | |
| Price / MA20: | +7.58% | |
| Price / MA50: | +15.49% | |
| Price / MA100: | +19.89% | |
| Price / MAexp7: | +0.13% | |
| Price / MAexp20: | +0.35% | |
| Price / MAexp50: | +1.21% | |
| Price / MAexp100: | +3.44% |
News
The last news published on LOGITECH N at the time of the generation of this analysis was as follows:
- Logitech Files Quarterly Report on Form 10-Q
- Logitech Announces Fourth Consecutive Quarter of Sales Growth
- Logitech Makes It Easier To Repair Your Electronic Devices and Keep Them Longer
- Logitech Makes It Easier to Repair Your Electronic Devices and Keep Them Longer
- Logitech Spot Makes the Invisible Visible in the Workplace
About author
Online


Add a comment
Comments
0 comments on the analysis LOGITECH N - 1H