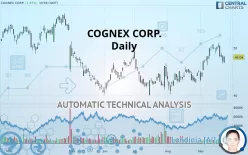
COGNEX CORP. - Daily - Technical analysis published on 09/26/2019 (GMT)
- 295
- 0
Click here for a new analysis!
- Timeframe : Daily
- - Analysis generated on
- Status : INVALID

Summary of the analysis

Additional analysis
Quotes
The COGNEX CORP. price is 48.04 USD. On the day, this instrument gained +1.97% and was traded between 46.77 USD and 48.27 USD over the period. The price is currently at +2.72% from its lowest and -0.48% from its highest.The Central Gaps scanner detects a bearish opening marking the presence of sellers ahead of buyers at the opening but not sufficiently marked to allow the price to register a quotation gap.
Bearish opening
Type : Bearish
Timeframe : Openning
A study of price movements over other periods shows the following variations:
Technical
Technical analysis of this Daily chart of COGNEX CORP. indicates that the overall trend is strongly bullish. 82.14% of the signals given by moving averages are bullish. This strongly bullish trend is supported by the strong bullish signals given by short-term moving averages. The Central Indicators scanner detects bearish signals on moving averages that could impact this trend:
Bearish price crossover with Moving Average 20
Type : Bearish
Timeframe : Daily
Bearish price crossover with adaptative moving average 20
Type : Bearish
Timeframe : Daily
The probability of a further increase is slight given the direction of the technical indicators.
Central Indicators, the detector scanner for these technical indicators has recently detected several signals:
RSI indicator is back under 50
Type : Bearish
Timeframe : Daily
Price is back under the pivot point
Type : Bearish
Timeframe : Daily
Price is back under the pivot point
Type : Bearish
Timeframe : Weekly
Momentum indicator is back under 0
Type : Bearish
Timeframe : Daily
Williams %R indicator is back under -50
Type : Bearish
Timeframe : Daily
Central Patterns, the market scanner focusing on chart patterns, resistances and supports found these results:
Horizontal support is broken
Type : Bearish
Timeframe : Daily
Support of channel is broken
Type : Bearish
Timeframe : Daily
The Central Candlesticks scanner which studies Japanese candlesticks did not detect anything.
| S3 | S2 | S1 | Price | R1 | R2 | R3 | |
|---|---|---|---|---|---|---|---|
| ProTrendLines | 43.74 | 46.12 | 47.99 | 48.04 | 50.45 | 54.66 | 56.84 |
| Change (%) | -8.95% | -4.00% | -0.10% | - | +5.02% | +13.78% | +18.32% |
| Change | -4.30 | -1.92 | -0.05 | - | +2.41 | +6.62 | +8.80 |
| Level | Major | Intermediate | Major | - | Major | Minor | Major |
To determine price objectives, it is also possible to use the pivot points. Here is the price position in relation to pivot points:
| Pivot points | S3 | S2 | S1 | PP | R1 | R2 | R3 |
|---|---|---|---|---|---|---|---|
| Standard | 44.55 | 45.58 | 46.35 | 47.38 | 48.15 | 49.18 | 49.95 |
| Camarilla | 46.62 | 46.78 | 46.95 | 47.11 | 47.28 | 47.44 | 47.61 |
| Woodie | 44.41 | 45.52 | 46.21 | 47.32 | 48.01 | 49.12 | 49.81 |
| Fibonacci | 45.58 | 46.27 | 46.70 | 47.38 | 48.07 | 48.50 | 49.18 |
| Pivot points | S3 | S2 | S1 | PP | R1 | R2 | R3 |
|---|---|---|---|---|---|---|---|
| Standard | 44.16 | 46.07 | 47.14 | 49.06 | 50.13 | 52.04 | 53.11 |
| Camarilla | 47.39 | 47.66 | 47.94 | 48.21 | 48.48 | 48.76 | 49.03 |
| Woodie | 43.73 | 45.86 | 46.72 | 48.84 | 49.70 | 51.83 | 52.69 |
| Fibonacci | 46.07 | 47.21 | 47.92 | 49.06 | 50.20 | 50.90 | 52.04 |
| Pivot points | S3 | S2 | S1 | PP | R1 | R2 | R3 |
|---|---|---|---|---|---|---|---|
| Standard | 35.89 | 38.05 | 41.56 | 43.72 | 47.23 | 49.39 | 52.90 |
| Camarilla | 43.52 | 44.04 | 44.56 | 45.08 | 45.60 | 46.12 | 46.64 |
| Woodie | 36.58 | 38.39 | 42.25 | 44.06 | 47.92 | 49.73 | 53.59 |
| Fibonacci | 38.05 | 40.21 | 41.55 | 43.72 | 45.88 | 47.22 | 49.39 |
Numerical data
The following are the details of the technical indicators and moving averages that were collected to generate this technical analysis:
| RSI (14): | 54.02 | |
| MACD (12,26,9): | 1.0400 | |
| Directional Movement: | -4.29 | |
| AROON (14): | 71.43 | |
| DEMA (21): | 49.19 | |
| Parabolic SAR (0,02-0,02-0,2): | 50.74 | |
| Elder Ray (13): | -0.74 | |
| Super Trend (3,10): | 46.72 | |
| Zig ZAG (10): | 48.04 | |
| VORTEX (21): | 1.0600 | |
| Stochastique (14,3,5): | 42.82 | |
| TEMA (21): | 49.49 | |
| Williams %R (14): | -62.61 | |
| Chande Momentum Oscillator (20): | 0.33 | |
| Repulse (5,40,3): | -0.8700 | |
| ROCnROLL: | -1 | |
| TRIX (15,9): | 0.4300 | |
| Courbe Coppock: | 14.78 |
| MA7: | 48.84 | |
| MA20: | 47.68 | |
| MA50: | 45.20 | |
| MA100: | 44.84 | |
| MAexp7: | 48.41 | |
| MAexp20: | 47.73 | |
| MAexp50: | 46.29 | |
| MAexp100: | 46.12 | |
| Price / MA7: | -1.64% | |
| Price / MA20: | +0.76% | |
| Price / MA50: | +6.28% | |
| Price / MA100: | +7.14% | |
| Price / MAexp7: | -0.76% | |
| Price / MAexp20: | +0.65% | |
| Price / MAexp50: | +3.78% | |
| Price / MAexp100: | +4.16% |
News
Don"t forget to follow the news on COGNEX CORP.. At the time of publication of this analysis, the latest news was as follows:
- Cognex Reports Record Fourth Quarter and Full Year Results for 2018
- Cognex Declares Quarterly Cash Dividend
- Cognex Corporation to Host Earnings Call
- Consolidated Research: 2018 Summary Expectations for R.R. Donnelley & Sons, Northern Oil and Gas, Ducommun, Cloud Peak Energy, Synovus Financial, and Cognex — Fundamental Analysis, Key Performance Indications
- Report: Developing Opportunities within Entravision Communications, Synovus Financial, Cognex, Cloud Peak Energy, R.R. Donnelley & Sons, and HealthSouth — Future Expectations, Projections Moving into 2018
About author

Online


Add a comment
Comments
0 comments on the analysis COGNEX CORP. - Daily