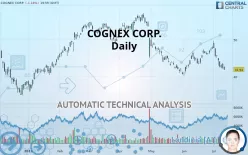
COGNEX CORP. - Daily - Technical analysis published on 07/12/2019 (GMT)
- 328
- 0
- Who voted?
Click here for a new analysis!
- Timeframe : Daily
- - Analysis generated on
- Status : TARGET REACHED

Summary of the analysis

Additional analysis
Quotes
COGNEX CORP. rating 41.94 USD. The price is lower by -1.18% since the last closing and was traded between 41.71 USD and 42.74 USD over the period. The price is currently at +0.55% from its lowest and -1.87% from its highest.A study of price movements over other periods shows the following variations:
Technical
Technical analysis of this Daily chart of COGNEX CORP. indicates that the overall trend is strongly bearish. 89.29% of the signals given by moving averages are bearish. The overall trend is supported by the strong bearish signals from short-term moving averages. There is no crossing of moving average by the price or crossing of moving averages between themselves.
In fact, according to the parameters integrated into the Central Analyzer system, 12 technical indicators out of 18 analysed are currently bearish. But beware of excesses. The Central Indicators scanner currently detects this:
CCI indicator is oversold : under -100
Type : Neutral
Timeframe : Daily
Williams %R indicator is oversold : under -80
Type : Neutral
Timeframe : Daily
Price is back under the pivot point
Type : Bearish
Timeframe : Daily
Price is back under the pivot point
Type : Bearish
Timeframe : Weekly
Central Patterns, the market scanner focusing on chart patterns, resistances and supports found this result:
Support of channel is broken
Type : Bearish
Timeframe : Daily
Central Candlesticks, the scanner specialised in Japanese candlesticks, detects a bearish signal that could support the hypothesis of a small drop in the very short term:
Bearish engulfing lines
Type : Bearish
Timeframe : Daily
| S3 | S2 | S1 | Price | R1 | R2 | R3 | |
|---|---|---|---|---|---|---|---|
| ProTrendLines | 25.80 | 34.94 | 40.69 | 41.94 | 43.74 | 47.38 | 51.49 |
| Change (%) | -38.48% | -16.69% | -2.98% | - | +4.29% | +12.97% | +22.77% |
| Change | -16.14 | -7.00 | -1.25 | - | +1.80 | +5.44 | +9.55 |
| Level | Major | Major | Major | - | Major | Major | Minor |
Pivot points can also be used to set your price objectives. Here is the price situation in relation to pivot points:
| Pivot points | S3 | S2 | S1 | PP | R1 | R2 | R3 |
|---|---|---|---|---|---|---|---|
| Standard | 40.29 | 41.17 | 41.81 | 42.69 | 43.32 | 44.20 | 44.84 |
| Camarilla | 42.02 | 42.16 | 42.30 | 42.44 | 42.58 | 42.72 | 42.86 |
| Woodie | 40.17 | 41.11 | 41.68 | 42.62 | 43.20 | 44.14 | 44.71 |
| Fibonacci | 41.17 | 41.75 | 42.11 | 42.69 | 43.26 | 43.62 | 44.20 |
| Pivot points | S3 | S2 | S1 | PP | R1 | R2 | R3 |
|---|---|---|---|---|---|---|---|
| Standard | 34.69 | 38.79 | 41.61 | 45.71 | 48.53 | 52.63 | 55.45 |
| Camarilla | 42.54 | 43.17 | 43.81 | 44.44 | 45.07 | 45.71 | 46.34 |
| Woodie | 34.06 | 38.47 | 40.98 | 45.39 | 47.90 | 52.31 | 54.82 |
| Fibonacci | 38.79 | 41.43 | 43.06 | 45.71 | 48.35 | 49.98 | 52.63 |
Numerical data
The following is the status of the technical indicators and moving averages at the time of publication of this technical analysis:
| RSI (14): | 34.93 | |
| MACD (12,26,9): | -0.6000 | |
| Directional Movement: | -8.39 | |
| AROON (14): | -50.00 | |
| DEMA (21): | 44.05 | |
| Parabolic SAR (0,02-0,02-0,2): | 48.39 | |
| Elder Ray (13): | -2.12 | |
| Super Trend (3,10): | 46.45 | |
| Zig ZAG (10): | 41.94 | |
| VORTEX (21): | 0.8000 | |
| Stochastique (14,3,5): | 6.45 | |
| TEMA (21): | 43.94 | |
| Williams %R (14): | -97.16 | |
| Chande Momentum Oscillator (20): | -4.31 | |
| Repulse (5,40,3): | -4.4500 | |
| ROCnROLL: | 2 | |
| TRIX (15,9): | 0.0100 | |
| Courbe Coppock: | 6.98 |
| MA7: | 43.72 | |
| MA20: | 45.24 | |
| MA50: | 44.83 | |
| MA100: | 49.04 | |
| MAexp7: | 43.55 | |
| MAexp20: | 44.66 | |
| MAexp50: | 45.75 | |
| MAexp100: | 46.74 | |
| Price / MA7: | -4.07% | |
| Price / MA20: | -7.29% | |
| Price / MA50: | -6.45% | |
| Price / MA100: | -14.48% | |
| Price / MAexp7: | -3.70% | |
| Price / MAexp20: | -6.09% | |
| Price / MAexp50: | -8.33% | |
| Price / MAexp100: | -10.27% |
News
The latest news and videos published on COGNEX CORP. at the time of the analysis were as follows:
- Cognex Reports Record Fourth Quarter and Full Year Results for 2018
- Cognex Declares Quarterly Cash Dividend
- Cognex Corporation to Host Earnings Call
- Consolidated Research: 2018 Summary Expectations for R.R. Donnelley & Sons, Northern Oil and Gas, Ducommun, Cloud Peak Energy, Synovus Financial, and Cognex — Fundamental Analysis, Key Performance Indications
- Report: Developing Opportunities within Entravision Communications, Synovus Financial, Cognex, Cloud Peak Energy, R.R. Donnelley & Sons, and HealthSouth — Future Expectations, Projections Moving into 2018
About author

Online


Add a comment
Comments
0 comments on the analysis COGNEX CORP. - Daily