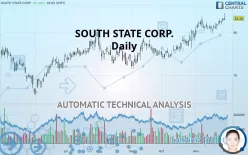
SOUTHSTATE CORP. - Daily - Technical analysis published on 12/02/2019 (GMT)
- 231
- 0
- Who voted?
Click here for a new analysis!
- Timeframe : Daily
- - Analysis generated on
- Status : TARGET REACHED

Summary of the analysis

Additional analysis
Quotes
The SOUTH STATE CORP. price is 83.28 USD. The price has increased by +0.14% since the last closing and was traded between 82.85 USD and 84.50 USD over the period. The price is currently at +0.52% from its lowest and -1.44% from its highest.The Central Gaps scanner detects a bearish opening marking the presence of sellers ahead of buyers at the opening but not sufficiently marked to allow the price to register a quotation gap.
Bearish opening
Type : Bearish
Timeframe : Openning
A study of price movements over other periods shows the following variations:
New HIGH record (1 year)
Type : Bullish
Timeframe : Weekly
New HIGH record (1st january)
Type : Bullish
Timeframe : Weekly
New HIGH record (1 month)
Type : Bullish
Timeframe : Weekly
Technical
Technical analysis of this Daily chart of SOUTH STATE CORP. indicates that the overall trend is strongly bullish. The signals given by the moving averages are 92.86% bullish. This strong bullish trend is confirmed by the strong signals currently being given by short-term moving averages. The Central Indicators market scanner currently does not detect any result that concerns moving averages.
The probability of a further increase is high given the direction of the technical indicators.
Caution: the Central Indicators scanner currently detects an excess:
RSI indicator is overbought : over 70
Type : Neutral
Timeframe : Daily
CCI indicator is overbought : over 100
Type : Neutral
Timeframe : Daily
Williams %R indicator is overbought : over -20
Type : Neutral
Timeframe : Daily
Pivot points : price is over resistance 1
Type : Neutral
Timeframe : Weekly
Parabolic SAR indicator bullish reversal
Type : Bullish
Timeframe : Daily
Price is back over the pivot point
Type : Bullish
Timeframe : Daily
No signals are given by Central Patterns, a market scanner specialised in chart patterns, resistances and supports.
The Central Candlesticks scanner, specialised in Japanese candlesticks, did not identify any signals.
| S3 | S2 | S1 | Price | R1 | R2 | R3 | |
|---|---|---|---|---|---|---|---|
| ProTrendLines | 76.25 | 80.88 | 82.43 | 83.28 | 84.13 | 88.85 | 92.74 |
| Change (%) | -8.44% | -2.88% | -1.02% | - | +1.02% | +6.69% | +11.36% |
| Change | -7.03 | -2.40 | -0.85 | - | +0.85 | +5.57 | +9.46 |
| Level | Major | Major | Intermediate | - | Major | Minor | Major |
Pivot points can also be used to set your price objectives. Here is the price situation in relation to pivot points:
| Pivot points | S3 | S2 | S1 | PP | R1 | R2 | R3 |
|---|---|---|---|---|---|---|---|
| Standard | 81.84 | 82.19 | 82.68 | 83.03 | 83.52 | 83.87 | 84.36 |
| Camarilla | 82.93 | 83.01 | 83.08 | 83.16 | 83.24 | 83.31 | 83.39 |
| Woodie | 81.90 | 82.23 | 82.74 | 83.07 | 83.58 | 83.91 | 84.42 |
| Fibonacci | 82.19 | 82.51 | 82.71 | 83.03 | 83.35 | 83.55 | 83.87 |
| Pivot points | S3 | S2 | S1 | PP | R1 | R2 | R3 |
|---|---|---|---|---|---|---|---|
| Standard | 77.45 | 78.62 | 80.34 | 81.51 | 83.23 | 84.40 | 86.12 |
| Camarilla | 81.26 | 81.52 | 81.79 | 82.05 | 82.32 | 82.58 | 82.85 |
| Woodie | 77.72 | 78.76 | 80.61 | 81.65 | 83.50 | 84.54 | 86.39 |
| Fibonacci | 78.62 | 79.73 | 80.41 | 81.51 | 82.62 | 83.30 | 84.40 |
| Pivot points | S3 | S2 | S1 | PP | R1 | R2 | R3 |
|---|---|---|---|---|---|---|---|
| Standard | 67.45 | 70.35 | 74.38 | 77.28 | 81.31 | 84.21 | 88.25 |
| Camarilla | 76.51 | 77.15 | 77.79 | 78.42 | 79.06 | 79.69 | 80.33 |
| Woodie | 68.02 | 70.63 | 74.95 | 77.56 | 81.89 | 84.49 | 88.82 |
| Fibonacci | 70.35 | 72.99 | 74.63 | 77.28 | 79.92 | 81.56 | 84.21 |
Numerical data
The following are the details of the technical indicators and moving averages that were collected to generate this technical analysis:
| RSI (14): | 71.15 | |
| MACD (12,26,9): | 1.2600 | |
| Directional Movement: | 22.49 | |
| AROON (14): | 57.14 | |
| DEMA (21): | 83.02 | |
| Parabolic SAR (0,02-0,02-0,2): | 79.87 | |
| Elder Ray (13): | 1.72 | |
| Super Trend (3,10): | 79.79 | |
| Zig ZAG (10): | 83.28 | |
| VORTEX (21): | 1.1600 | |
| Stochastique (14,3,5): | 79.66 | |
| TEMA (21): | 83.17 | |
| Williams %R (14): | -25.96 | |
| Chande Momentum Oscillator (20): | 1.50 | |
| Repulse (5,40,3): | 0.6600 | |
| ROCnROLL: | 1 | |
| TRIX (15,9): | 0.2300 | |
| Courbe Coppock: | 3.10 |
| MA7: | 82.40 | |
| MA20: | 81.64 | |
| MA50: | 78.25 | |
| MA100: | 76.57 | |
| MAexp7: | 82.52 | |
| MAexp20: | 81.32 | |
| MAexp50: | 79.11 | |
| MAexp100: | 76.89 | |
| Price / MA7: | +1.07% | |
| Price / MA20: | +2.01% | |
| Price / MA50: | +6.43% | |
| Price / MA100: | +8.76% | |
| Price / MAexp7: | +0.92% | |
| Price / MAexp20: | +2.41% | |
| Price / MAexp50: | +5.27% | |
| Price / MAexp100: | +8.31% |
News
Don"t forget to follow the news on SOUTH STATE CORP.. At the time of publication of this analysis, the latest news was as follows:
- South State Corporation to Announce Third Quarter 2019 Financial Results and Host Conference Call October 29, 2019
- South State Bank Named to Forbes’ 100 Best Banks in America & Women’s Choice Award® Best Companies for Women Lists
- South State Bank Earns 12 Greenwich Excellence and Best Brand Awards
- Greg Lapointe Named President of South State Bank
- South State Earns Top Honors in S.C.
About author

Online


Add a comment
Comments
0 comments on the analysis SOUTHSTATE CORP. - Daily