| Open: | - |
| Change: | - |
| Volume: | - |
| Low: | - |
| High: | - |
| High / Low range: | - |
| Type: | Stocks |
| Ticker: | SSB |
| ISIN: |
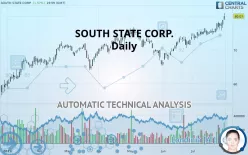
SOUTHSTATE CORP. - Daily - Technical analysis published on 08/01/2019 (GMT)
- 256
- 0
- 08/01/2019 - 13:20
- Who voted?
Click here for a new analysis!
- Timeframe : Daily
- - Analysis generated on 08/01/2019 - 13:20
- Status : INVALID

Summary of the analysis

Additional analysis
Quotes
The SOUTH STATE CORP. price is 80.07 USD. The price registered an increase of +1.57% on the session with the lowest point at 79.00 USD and the highest point at 80.95 USD. The deviation from the price is +1.35% for the low point and -1.09% for the high point.A bullish gap was detected at the opening by the Central Gaps scanner. There are a lot of buyers and they have the upper hand in the very short term.
Opening Gap UP
Type : Bullish
Timeframe : Openning
Here is a more detailed summary of the historical variations registered by SOUTH STATE CORP.:
Technical
Technical analysis of this Daily chart of SOUTH STATE CORP. indicates that the overall trend is strongly bullish. 92.86% of the signals given by moving averages are bullish. The overall trend is supported by the strong bullish signals from short-term moving averages. The Central Indicators scanner does not detect any result on moving averages that would impact this trend.
In fact, 16 technical indicators on 18 studied are currently positioned bullish. Caution: the Central Indicators scanner currently detects an excess:
CCI indicator is overbought : over 100
Type : Neutral
Timeframe : Daily
Williams %R indicator is overbought : over -20
Type : Neutral
Timeframe : Daily
Pivot points : price is over resistance 1
Type : Neutral
Timeframe : Daily
Pivot points : price is over resistance 1
Type : Neutral
Timeframe : Weekly
Central Patterns, the market scanner focusing on chart patterns, resistances and supports found these results:
Near horizontal resistance
Type : Bearish
Timeframe : Daily
Resistance of channel is broken
Type : Bullish
Timeframe : Daily
No result was found by the Central Candlesticks scanner on Japanese candlesticks.
| S3 | S2 | S1 | Price | R1 | R2 | R3 | |
|---|---|---|---|---|---|---|---|
| ProTrendLines | 65.89 | 71.23 | 76.27 | 80.07 | 80.88 | 84.13 | 88.85 |
| Change (%) | -17.71% | -11.04% | -4.75% | - | +1.01% | +5.07% | +10.97% |
| Change | -14.18 | -8.84 | -3.80 | - | +0.81 | +4.06 | +8.78 |
| Level | Minor | Intermediate | Major | - | Minor | Intermediate | Minor |
To determine price objectives, it is also possible to use the pivot points. Here is the price position in relation to pivot points:
| Pivot points | S3 | S2 | S1 | PP | R1 | R2 | R3 |
|---|---|---|---|---|---|---|---|
| Standard | 74.83 | 75.66 | 77.25 | 78.08 | 79.67 | 80.50 | 82.09 |
| Camarilla | 78.17 | 78.39 | 78.61 | 78.83 | 79.05 | 79.27 | 79.50 |
| Woodie | 75.20 | 75.85 | 77.62 | 78.27 | 80.04 | 80.69 | 82.46 |
| Fibonacci | 75.66 | 76.59 | 77.16 | 78.08 | 79.01 | 79.58 | 80.50 |
| Pivot points | S3 | S2 | S1 | PP | R1 | R2 | R3 |
|---|---|---|---|---|---|---|---|
| Standard | 72.20 | 73.54 | 75.70 | 77.04 | 79.20 | 80.54 | 82.70 |
| Camarilla | 76.89 | 77.21 | 77.53 | 77.85 | 78.17 | 78.49 | 78.81 |
| Woodie | 72.60 | 73.75 | 76.10 | 77.25 | 79.60 | 80.75 | 83.10 |
| Fibonacci | 73.54 | 74.88 | 75.71 | 77.04 | 78.38 | 79.21 | 80.54 |
| Pivot points | S3 | S2 | S1 | PP | R1 | R2 | R3 |
|---|---|---|---|---|---|---|---|
| Standard | 58.08 | 61.67 | 67.67 | 71.26 | 77.26 | 80.85 | 86.85 |
| Camarilla | 71.03 | 71.91 | 72.79 | 73.67 | 74.55 | 75.43 | 76.31 |
| Woodie | 59.29 | 62.27 | 68.88 | 71.86 | 78.47 | 81.45 | 88.06 |
| Fibonacci | 61.67 | 65.33 | 67.60 | 71.26 | 74.92 | 77.19 | 80.85 |
Numerical data
The following is the status of technical indicators and moving averages registered at the time this technical analysis was created:
| RSI (14): | 69.24 | |
| MACD (12,26,9): | 1.5100 | |
| Directional Movement: | 19.08 | |
| AROON (14): | 85.71 | |
| DEMA (21): | 78.14 | |
| Parabolic SAR (0,02-0,02-0,2): | 75.33 | |
| Elder Ray (13): | 2.92 | |
| Super Trend (3,10): | 74.79 | |
| Zig ZAG (10): | 80.07 | |
| VORTEX (21): | 1.1200 | |
| Stochastique (14,3,5): | 84.59 | |
| TEMA (21): | 78.81 | |
| Williams %R (14): | -13.23 | |
| Chande Momentum Oscillator (20): | 5.23 | |
| Repulse (5,40,3): | 3.7200 | |
| ROCnROLL: | 1 | |
| TRIX (15,9): | 0.2500 | |
| Courbe Coppock: | 7.81 |
| MA7: | 77.84 | |
| MA20: | 76.09 | |
| MA50: | 72.91 | |
| MA100: | 72.27 | |
| MAexp7: | 78.00 | |
| MAexp20: | 76.24 | |
| MAexp50: | 74.22 | |
| MAexp100: | 72.81 | |
| Price / MA7: | +2.86% | |
| Price / MA20: | +5.23% | |
| Price / MA50: | +9.82% | |
| Price / MA100: | +10.79% | |
| Price / MAexp7: | +2.65% | |
| Price / MAexp20: | +5.02% | |
| Price / MAexp50: | +7.88% | |
| Price / MAexp100: | +9.97% |
News
The last news published on SOUTH STATE CORP. at the time of the generation of this analysis was as follows:
- 02/13/2019 - 15:00 South State Bank Named to Forbes’ 100 Best Banks in America & Women’s Choice Award® Best Companies for Women Lists
- 02/06/2019 - 20:00 South State Bank Earns 12 Greenwich Excellence and Best Brand Awards
- 07/19/2018 - 19:00 Greg Lapointe Named President of South State Bank
- 07/11/2018 - 14:00 South State Earns Top Honors in S.C.
- 06/26/2018 - 13:00 South State Adds Private Banking Team in Richmond
About author

Online


Add a comment
Comments
0 comments on the analysis SOUTHSTATE CORP. - Daily