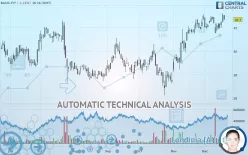
BASIC-FIT - Daily - Technical analysis published on 12/19/2019 (GMT)
- 314
- 0
- Who voted?
Click here for a new analysis!
- Timeframe : Daily
- - Analysis generated on
- Status : TARGET REACHED

Summary of the analysis

Additional analysis
Quotes
BASIC-FIT rating 32.70 EUR. The price is lower by -1.21% since the last closing and was between 32.70 EUR and 33.10 EUR. This implies that the price is at 0% from its lowest and at -1.21% from its highest.The Central Gaps scanner detects a bearish opening. A small advantage for sellers in the very short term.
Bearish opening
Type : Bearish
Timeframe : Openning
Here is a more detailed summary of the historical variations registered by BASIC-FIT:
Near a new HIGH record (1st january)
Type : Bullish
Timeframe : Weekly
Technical
A technical analysis in Daily of this BASIC-FIT chart shows a strongly bullish trend. 92.86% of the signals given by moving averages are bullish. The overall trend is supported by the strong bullish signals from short-term moving averages. There is no crossing of moving average by the price or crossing of moving averages between themselves.
An assessment of technical indicators shows a moderate bullish signal.
But beware of excesses. The Central Indicators scanner currently detects this:
CCI indicator is overbought : over 100
Type : Neutral
Timeframe : Daily
Williams %R indicator is overbought : over -20
Type : Neutral
Timeframe : Daily
Pivot points : price is over resistance 1
Type : Neutral
Timeframe : Weekly
Parabolic SAR indicator bullish reversal
Type : Bullish
Timeframe : Daily
Aroon indicator bullish trend
Type : Bullish
Timeframe : Daily
Price is back over the pivot point
Type : Bullish
Timeframe : Daily
Price is back under the pivot point
Type : Bearish
Timeframe : Weekly
Momentum indicator is back over 0
Type : Bullish
Timeframe : Daily
Central Patterns, the market scanner focusing on chart patterns, resistances and supports found these results:
Near horizontal support
Type : Bullish
Timeframe : Daily
Support of channel is broken
Type : Bearish
Timeframe : Daily
The Central Candlesticks scanner, specialised in Japanese candlesticks, did not identify any signals.
| S3 | S2 | S1 | Price | |
|---|---|---|---|---|
| ProTrendLines | 30.53 | 31.64 | 32.52 | 32.70 |
| Change (%) | -6.64% | -3.24% | -0.55% | - |
| Change | -2.17 | -1.06 | -0.18 | - |
| Level | Major | Major | Intermediate | - |
To determine price objectives, it is also possible to use the pivot points. Here is the price position in relation to pivot points:
| Pivot points | S3 | S2 | S1 | PP | R1 | R2 | R3 |
|---|---|---|---|---|---|---|---|
| Standard | 31.82 | 32.13 | 32.62 | 32.93 | 33.42 | 33.73 | 34.22 |
| Camarilla | 32.88 | 32.95 | 33.03 | 33.10 | 33.17 | 33.25 | 33.32 |
| Woodie | 31.90 | 32.18 | 32.70 | 32.98 | 33.50 | 33.78 | 34.30 |
| Fibonacci | 32.13 | 32.44 | 32.63 | 32.93 | 33.24 | 33.43 | 33.73 |
| Pivot points | S3 | S2 | S1 | PP | R1 | R2 | R3 |
|---|---|---|---|---|---|---|---|
| Standard | 29.90 | 30.70 | 31.35 | 32.15 | 32.80 | 33.60 | 34.25 |
| Camarilla | 31.60 | 31.73 | 31.87 | 32.00 | 32.13 | 32.27 | 32.40 |
| Woodie | 29.83 | 30.66 | 31.28 | 32.11 | 32.73 | 33.56 | 34.18 |
| Fibonacci | 30.70 | 31.25 | 31.60 | 32.15 | 32.70 | 33.05 | 33.60 |
| Pivot points | S3 | S2 | S1 | PP | R1 | R2 | R3 |
|---|---|---|---|---|---|---|---|
| Standard | 24.60 | 26.40 | 29.55 | 31.35 | 34.50 | 36.30 | 39.45 |
| Camarilla | 31.34 | 31.79 | 32.25 | 32.70 | 33.15 | 33.61 | 34.06 |
| Woodie | 25.28 | 26.74 | 30.23 | 31.69 | 35.18 | 36.64 | 40.13 |
| Fibonacci | 26.40 | 28.29 | 29.46 | 31.35 | 33.24 | 34.41 | 36.30 |
Numerical data
The following are the details of the technical indicators and moving averages that were collected to generate this technical analysis:
| RSI (14): | 61.12 | |
| MACD (12,26,9): | 0.5000 | |
| Directional Movement: | 11.18 | |
| AROON (14): | 35.72 | |
| DEMA (21): | 32.84 | |
| Parabolic SAR (0,02-0,02-0,2): | 31.53 | |
| Elder Ray (13): | 0.55 | |
| Super Trend (3,10): | 31.16 | |
| Zig ZAG (10): | 32.70 | |
| VORTEX (21): | 1.0600 | |
| Stochastique (14,3,5): | 77.34 | |
| TEMA (21): | 32.79 | |
| Williams %R (14): | -20.00 | |
| Chande Momentum Oscillator (20): | 0.75 | |
| Repulse (5,40,3): | 0.8300 | |
| ROCnROLL: | 1 | |
| TRIX (15,9): | 0.2800 | |
| Courbe Coppock: | 1.35 |
| MA7: | 32.34 | |
| MA20: | 32.35 | |
| MA50: | 30.58 | |
| MA100: | 29.61 | |
| MAexp7: | 32.55 | |
| MAexp20: | 32.12 | |
| MAexp50: | 31.11 | |
| MAexp100: | 30.33 | |
| Price / MA7: | +1.11% | |
| Price / MA20: | +1.08% | |
| Price / MA50: | +6.93% | |
| Price / MA100: | +10.44% | |
| Price / MAexp7: | +0.46% | |
| Price / MAexp20: | +1.81% | |
| Price / MAexp50: | +5.11% | |
| Price / MAexp100: | +7.81% |
About author

Online


Add a comment
Comments
0 comments on the analysis BASIC-FIT - Daily