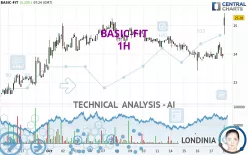
BASIC-FIT - 1H - Technical analysis published on 10/18/2024 (GMT)
- 134
- 0
Click here for a new analysis!
- Timeframe : 1H
- - Analysis generated on
- Status : INVALID
Summary of the analysis

Additional analysis
Quotes
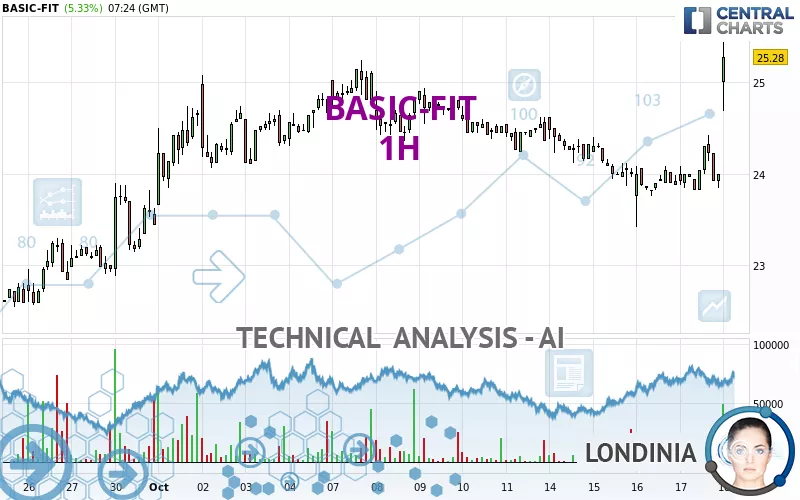
BASIC-FIT rating 25.28 EUR. The price has increased by +5.33% since the last closing with the lowest point at 24.68 EUR and the highest point at 25.44 EUR. The deviation from the price is +2.43% for the low point and -0.63% for the high point.A bullish gap was detected at the opening by the Central Gaps scanner. There are a lot of buyers and they have the upper hand in the very short term.
Opening Gap UP
Type : Bullish
Timeframe : Openning
Here is a more detailed summary of the historical variations registered by BASIC-FIT:
New HIGH record (1 month)
Type : Bullish
Timeframe : Weekly
Technical
Technical analysis of this 1H chart of BASIC-FIT indicates that the overall trend is bullish. The signals returned by the moving averages are 75.00% bullish. This bullish trend is reinforced by the strong signals currently being given by short-term moving averages. The Central Indicators market scanner is currently detecting several bullish signals that could impact this trend:
Bullish price crossover with Moving Average 50
Type : Bullish
Timeframe : 1 hour
Bullish price crossover with Moving Average 100
Type : Bullish
Timeframe : 1 hour
Bullish price crossover with adaptative moving average 20
Type : Bullish
Timeframe : 1 hour
Bullish price crossover with adaptative moving average 50
Type : Bullish
Timeframe : 1 hour
Bullish price crossover with adaptative moving average 100
Type : Bullish
Timeframe : 1 hour
In fact, according to the parameters integrated into the Central Analyzer system, 14 technical indicators out of 18 analysed are currently bullish. But beware of excesses. The Central Indicators scanner currently detects this:
RSI indicator is overbought : over 70
Type : Neutral
Timeframe : 1 hour
CCI indicator is overbought : over 100
Type : Neutral
Timeframe : 1 hour
Williams %R indicator is overbought : over -20
Type : Neutral
Timeframe : 1 hour
Pivot points : price is over resistance 1
Type : Neutral
Timeframe : Weekly
Pivot points : price is over resistance 3
Type : Neutral
Timeframe : 1 hour
Ichimoku : price is over the cloud
Type : Bullish
Timeframe : 1 hour
SuperTrend indicator bullish reversal
Type : Bullish
Timeframe : 1 hour
MACD indicator is back over 0
Type : Bullish
Timeframe : 1 hour
The analysis of the price chart with Central Patterns scanners does not return any result.
Central Candlesticks, the scanner specialised in Japanese candlesticks, detects these signals that could have an impact on the current short-term trend:
Upside gap
Type : Bullish
Timeframe : 1 hour
Doji
Type : Neutral
Timeframe : 1 hour
Long white line
Type : Bullish
Timeframe : 1 hour
| S3 | S2 | S1 | Price | R1 | R2 | R3 | |
|---|---|---|---|---|---|---|---|
| ProTrendLines | 24.08 | 24.62 | 25.10 | 25.28 | 26.30 | 27.29 | 28.29 |
| Change (%) | -4.75% | -2.61% | -0.71% | - | +4.03% | +7.95% | +11.91% |
| Change | -1.20 | -0.66 | -0.18 | - | +1.02 | +2.01 | +3.01 |
| Level | Intermediate | Minor | Major | - | Minor | Minor | Intermediate |
Pivot points can also be used to set your price objectives. Here is the price situation in relation to pivot points:
| Pivot points | S3 | S2 | S1 | PP | R1 | R2 | R3 |
|---|---|---|---|---|---|---|---|
| Standard | 23.14 | 23.48 | 23.74 | 24.08 | 24.34 | 24.68 | 24.94 |
| Camarilla | 23.84 | 23.89 | 23.95 | 24.00 | 24.06 | 24.11 | 24.17 |
| Woodie | 23.10 | 23.46 | 23.70 | 24.06 | 24.30 | 24.66 | 24.90 |
| Fibonacci | 23.48 | 23.71 | 23.85 | 24.08 | 24.31 | 24.45 | 24.68 |
| Pivot points | S3 | S2 | S1 | PP | R1 | R2 | R3 |
|---|---|---|---|---|---|---|---|
| Standard | 22.99 | 23.61 | 23.99 | 24.61 | 24.99 | 25.61 | 25.99 |
| Camarilla | 24.09 | 24.18 | 24.27 | 24.36 | 24.45 | 24.54 | 24.64 |
| Woodie | 22.86 | 23.55 | 23.86 | 24.55 | 24.86 | 25.55 | 25.86 |
| Fibonacci | 23.61 | 24.00 | 24.23 | 24.61 | 25.00 | 25.23 | 25.61 |
| Pivot points | S3 | S2 | S1 | PP | R1 | R2 | R3 |
|---|---|---|---|---|---|---|---|
| Standard | 19.76 | 20.68 | 22.06 | 22.98 | 24.36 | 25.28 | 26.66 |
| Camarilla | 22.81 | 23.02 | 23.23 | 23.44 | 23.65 | 23.86 | 24.07 |
| Woodie | 19.99 | 20.80 | 22.29 | 23.10 | 24.59 | 25.40 | 26.89 |
| Fibonacci | 20.68 | 21.56 | 22.10 | 22.98 | 23.86 | 24.40 | 25.28 |
Numerical data
The following is the status of technical indicators and moving averages registered at the time this technical analysis was created:
| RSI (14): | 66.61 | |
| MACD (12,26,9): | 0.0300 | |
| Directional Movement: | 26.12 | |
| AROON (14): | 100.00 | |
| DEMA (21): | 24.11 | |
| Parabolic SAR (0,02-0,02-0,2): | 23.82 | |
| Elder Ray (13): | 0.72 | |
| Super Trend (3,10): | 24.04 | |
| Zig ZAG (10): | 24.80 | |
| VORTEX (21): | 1.0000 | |
| Stochastique (14,3,5): | 50.48 | |
| TEMA (21): | 24.32 | |
| Williams %R (14): | -2.82 | |
| Chande Momentum Oscillator (20): | 1.00 | |
| Repulse (5,40,3): | 0.1300 | |
| ROCnROLL: | 1 | |
| TRIX (15,9): | -0.0300 | |
| Courbe Coppock: | 2.76 |
| MA7: | 24.33 | |
| MA20: | 23.98 | |
| MA50: | 23.05 | |
| MA100: | 22.13 | |
| MAexp7: | 24.31 | |
| MAexp20: | 24.10 | |
| MAexp50: | 24.18 | |
| MAexp100: | 24.14 | |
| Price / MA7: | +3.90% | |
| Price / MA20: | +5.42% | |
| Price / MA50: | +9.67% | |
| Price / MA100: | +14.23% | |
| Price / MAexp7: | +3.99% | |
| Price / MAexp20: | +4.90% | |
| Price / MAexp50: | +4.55% | |
| Price / MAexp100: | +4.72% |
News
The last news published on BASIC-FIT at the time of the generation of this analysis was as follows:
About author
Online


Add a comment
Comments
0 comments on the analysis BASIC-FIT - 1H