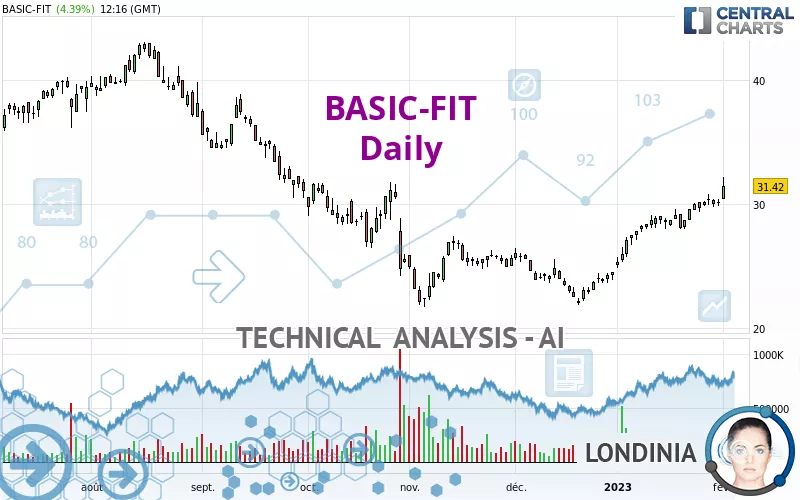
BASIC-FIT - Daily - Technical analysis published on 02/01/2023 (GMT)
- 219
- 0
Click here for a new analysis!
- Timeframe : Daily
- - Analysis generated on
- Status : TARGET REACHED
Summary of the analysis

Additional analysis
Quotes
The BASIC-FIT price is 31.42 EUR. On the day, this instrument gained +4.39% and was between 30.36 EUR and 32.16 EUR. This implies that the price is at +3.49% from its lowest and at -2.30% from its highest.The Central Gaps scanner detects a bullish opening. A small advantage for buyers in the very short term.
Bullish opening
Type : Bullish
Timeframe : Openning
A study of price movements over other periods shows the following variations:
New HIGH record (1st january)
Type : Bullish
Timeframe : Weekly
New HIGH record (1 month)
Type : Bullish
Timeframe : Weekly
Technical
A technical analysis in Daily of this BASIC-FIT chart shows a bullish trend. 75.00% of the signals given by moving averages are bullish. This bullish trend is supported by the strong bullish signals given by short-term moving averages. The Central Indicators scanner detects a bullish signal on moving averages that could impact this trend:
Moving Average bullish crossovers : AMA50 & AMA100
Type : Bullish
Timeframe : Daily
In fact, 15 technical indicators on 18 studied are currently bullish. But beware of excesses. The Central Indicators scanner currently detects this:
RSI indicator is overbought : over 70
Type : Neutral
Timeframe : Daily
CCI indicator is overbought : over 100
Type : Neutral
Timeframe : Daily
Williams %R indicator is overbought : over -20
Type : Neutral
Timeframe : Daily
Pivot points : price is over resistance 1
Type : Neutral
Timeframe : Weekly
Pivot points : price is over resistance 3
Type : Neutral
Timeframe : Daily
Central Patterns, the market scanner focusing on chart patterns, resistances and supports found this result:
Near resistance of channel
Type : Bearish
Timeframe : Daily
The Central Candlesticks scanner which studies Japanese candlesticks did not detect anything.
| S3 | S2 | S1 | Price | R1 | R2 | R3 | |
|---|---|---|---|---|---|---|---|
| ProTrendLines | 23.84 | 27.07 | 28.84 | 31.42 | 32.47 | 35.30 | 37.86 |
| Change (%) | -24.12% | -13.84% | -8.21% | - | +3.34% | +12.35% | +20.50% |
| Change | -7.58 | -4.35 | -2.58 | - | +1.05 | +3.88 | +6.44 |
| Level | Minor | Major | Major | - | Major | Intermediate | Intermediate |
Pivot points can also be used to set your price objectives. Here is the price situation in relation to pivot points:
| Pivot points | S3 | S2 | S1 | PP | R1 | R2 | R3 |
|---|---|---|---|---|---|---|---|
| Standard | 29.30 | 29.58 | 29.84 | 30.12 | 30.38 | 30.66 | 30.92 |
| Camarilla | 29.95 | 30.00 | 30.05 | 30.10 | 30.15 | 30.20 | 30.25 |
| Woodie | 29.29 | 29.58 | 29.83 | 30.12 | 30.37 | 30.66 | 30.91 |
| Fibonacci | 29.58 | 29.79 | 29.91 | 30.12 | 30.33 | 30.45 | 30.66 |
| Pivot points | S3 | S2 | S1 | PP | R1 | R2 | R3 |
|---|---|---|---|---|---|---|---|
| Standard | 26.99 | 27.85 | 29.09 | 29.95 | 31.19 | 32.05 | 33.29 |
| Camarilla | 29.76 | 29.96 | 30.15 | 30.34 | 30.53 | 30.73 | 30.92 |
| Woodie | 27.19 | 27.95 | 29.29 | 30.05 | 31.39 | 32.15 | 33.49 |
| Fibonacci | 27.85 | 28.65 | 29.14 | 29.95 | 30.75 | 31.24 | 32.05 |
| Pivot points | S3 | S2 | S1 | PP | R1 | R2 | R3 |
|---|---|---|---|---|---|---|---|
| Standard | 20.33 | 22.57 | 26.33 | 28.57 | 32.33 | 34.57 | 38.33 |
| Camarilla | 28.45 | 29.00 | 29.55 | 30.10 | 30.65 | 31.20 | 31.75 |
| Woodie | 21.10 | 22.95 | 27.10 | 28.95 | 33.10 | 34.95 | 39.10 |
| Fibonacci | 22.57 | 24.86 | 26.28 | 28.57 | 30.86 | 32.28 | 34.57 |
Numerical data
The following is the status of the technical indicators and moving averages at the time of publication of this technical analysis:
| RSI (14): | 74.29 | |
| MACD (12,26,9): | 1.2500 | |
| Directional Movement: | 33.01 | |
| AROON (14): | 85.71 | |
| DEMA (21): | 30.54 | |
| Parabolic SAR (0,02-0,02-0,2): | 29.78 | |
| Elder Ray (13): | 1.65 | |
| Super Trend (3,10): | 28.61 | |
| Zig ZAG (10): | 31.50 | |
| VORTEX (21): | 1.2600 | |
| Stochastique (14,3,5): | 77.16 | |
| TEMA (21): | 31.18 | |
| Williams %R (14): | -15.71 | |
| Chande Momentum Oscillator (20): | 2.98 | |
| Repulse (5,40,3): | 2.8300 | |
| ROCnROLL: | 1 | |
| TRIX (15,9): | 0.6700 | |
| Courbe Coppock: | 14.25 |
| MA7: | 30.21 | |
| MA20: | 29.11 | |
| MA50: | 26.35 | |
| MA100: | 27.63 | |
| MAexp7: | 30.22 | |
| MAexp20: | 28.93 | |
| MAexp50: | 27.71 | |
| MAexp100: | 28.80 | |
| Price / MA7: | +4.01% | |
| Price / MA20: | +7.94% | |
| Price / MA50: | +19.24% | |
| Price / MA100: | +13.72% | |
| Price / MAexp7: | +3.97% | |
| Price / MAexp20: | +8.61% | |
| Price / MAexp50: | +13.39% | |
| Price / MAexp100: | +9.10% |
News
The last news published on BASIC-FIT at the time of the generation of this analysis was as follows:
About author
Online


Add a comment
Comments
0 comments on the analysis BASIC-FIT - Daily