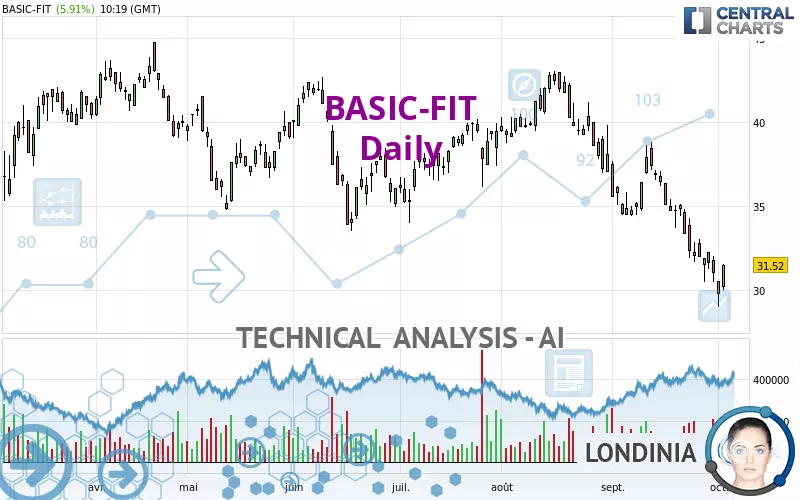
BASIC-FIT - Daily - Technical analysis published on 10/04/2022 (GMT)
- 196
- 0
Click here for a new analysis!
- Timeframe : Daily
- - Analysis generated on
- Status : TARGET REACHED

Summary of the analysis

Additional analysis
Quotes
The BASIC-FIT price is 31.52 EUR. The price has increased by +5.91% since the last closing and was between 30.02 EUR and 31.58 EUR. This implies that the price is at +5.00% from its lowest and at -0.19% from its highest.A bullish opening was detected by the Central Gaps scanner. Buyers are trying to impose a bullish momentum in the very short term.
Bullish opening
Type : Bullish
Timeframe : Openning
A study of price movements over other periods shows the following variations:
Near a new LOW record (1 year)
Type : Bearish
Timeframe : Weekly
Near a new LOW record (1st january)
Type : Bearish
Timeframe : Weekly
Near a new LOW record (1 month)
Type : Bearish
Timeframe : Weekly
Technical
Technical analysis of BASIC-FIT in Daily shows a overall strongly bearish trend. The signals given by moving averages are 92.86% bearish. This strong bearish trend is confirmed by the strong signals currently being given by short-term moving averages. There is no crossing of moving average by the price or crossing of moving averages between themselves.
An assessment of technical indicators does not currently provide any relevant information on the direction of future price movements.
Caution: the Central Indicators scanner currently detects an excess:
CCI indicator is oversold : under -100
Type : Neutral
Timeframe : Daily
CCI indicator: bullish divergence
Type : Bullish
Timeframe : Daily
Pivot points : price is over resistance 2
Type : Neutral
Timeframe : Daily
Central Patterns, the scanner specializing in chart patterns, did not identify any signals.
For a small rebound in the very short term, the Central Candlesticks scanner currently notes the presence of this bullish pattern in Japanese candlesticks:
White morning star
Type : Bullish
Timeframe : Daily
| S3 | S2 | S1 | Price | R1 | R2 | R3 | |
|---|---|---|---|---|---|---|---|
| ProTrendLines | 15.28 | 20.26 | 27.07 | 31.52 | 33.91 | 35.70 | 37.44 |
| Change (%) | -51.52% | -35.72% | -14.12% | - | +7.58% | +13.26% | +18.78% |
| Change | -16.24 | -11.26 | -4.45 | - | +2.39 | +4.18 | +5.92 |
| Level | Minor | Intermediate | Major | - | Major | Minor | Intermediate |
Pivot points can also be used to set your price objectives. Here is the price situation in relation to pivot points:
| Pivot points | S3 | S2 | S1 | PP | R1 | R2 | R3 |
|---|---|---|---|---|---|---|---|
| Standard | 27.48 | 28.24 | 29.00 | 29.76 | 30.52 | 31.28 | 32.04 |
| Camarilla | 29.34 | 29.48 | 29.62 | 29.76 | 29.90 | 30.04 | 30.18 |
| Woodie | 27.48 | 28.24 | 29.00 | 29.76 | 30.52 | 31.28 | 32.04 |
| Fibonacci | 28.24 | 28.82 | 29.18 | 29.76 | 30.34 | 30.70 | 31.28 |
| Pivot points | S3 | S2 | S1 | PP | R1 | R2 | R3 |
|---|---|---|---|---|---|---|---|
| Standard | 27.35 | 28.91 | 29.95 | 31.51 | 32.55 | 34.11 | 35.15 |
| Camarilla | 30.29 | 30.52 | 30.76 | 31.00 | 31.24 | 31.48 | 31.72 |
| Woodie | 27.10 | 28.78 | 29.70 | 31.38 | 32.30 | 33.98 | 34.90 |
| Fibonacci | 28.91 | 29.90 | 30.51 | 31.51 | 32.50 | 33.11 | 34.11 |
| Pivot points | S3 | S2 | S1 | PP | R1 | R2 | R3 |
|---|---|---|---|---|---|---|---|
| Standard | 19.65 | 25.05 | 28.03 | 33.43 | 36.41 | 41.81 | 44.79 |
| Camarilla | 28.70 | 29.46 | 30.23 | 31.00 | 31.77 | 32.54 | 33.31 |
| Woodie | 18.43 | 24.45 | 26.81 | 32.83 | 35.19 | 41.21 | 43.57 |
| Fibonacci | 25.05 | 28.25 | 30.23 | 33.43 | 36.63 | 38.61 | 41.81 |
Numerical data
The following is the status of technical indicators and moving averages registered at the time this technical analysis was created:
| RSI (14): | 35.22 | |
| MACD (12,26,9): | -1.8300 | |
| Directional Movement: | -21.06 | |
| AROON (14): | -92.86 | |
| DEMA (21): | 31.27 | |
| Parabolic SAR (0,02-0,02-0,2): | 33.12 | |
| Elder Ray (13): | -1.78 | |
| Super Trend (3,10): | 34.04 | |
| Zig ZAG (10): | 31.46 | |
| VORTEX (21): | 0.7900 | |
| Stochastique (14,3,5): | 15.37 | |
| TEMA (21): | 30.39 | |
| Williams %R (14): | -69.63 | |
| Chande Momentum Oscillator (20): | -3.62 | |
| Repulse (5,40,3): | 2.1600 | |
| ROCnROLL: | 2 | |
| TRIX (15,9): | -0.6300 | |
| Courbe Coppock: | 25.84 |
| MA7: | 31.43 | |
| MA20: | 34.01 | |
| MA50: | 37.25 | |
| MA100: | 37.66 | |
| MAexp7: | 31.57 | |
| MAexp20: | 33.57 | |
| MAexp50: | 35.88 | |
| MAexp100: | 37.30 | |
| Price / MA7: | +0.29% | |
| Price / MA20: | -7.32% | |
| Price / MA50: | -15.38% | |
| Price / MA100: | -16.30% | |
| Price / MAexp7: | -0.16% | |
| Price / MAexp20: | -6.11% | |
| Price / MAexp50: | -12.15% | |
| Price / MAexp100: | -15.50% |
News
The latest news and videos published on BASIC-FIT at the time of the analysis were as follows:
About author
Online


Add a comment
Comments
0 comments on the analysis BASIC-FIT - Daily