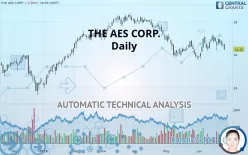
THE AES CORP. - Daily - Technical analysis published on 06/27/2019 (GMT)
- 283
- 0
- Who voted?
Oops, I was wrong about that analysis. My threshold for invalidation has been broken.
Click here for a new analysis!
Click here for a new analysis!
- Timeframe : Daily
- - Analysis generated on
- Status : INVALID

Summary of the analysis
Trends
Court terme:
Bearish
De fond:
Strongly bearish
Technical indicators
28%
44%
28%
My opinion
Bearish under 16.93 USD
My targets
16.00 USD (-1.96%)
15.57 USD (-4.60%)
My analysis
The bearish basic trend is very strong on THE AES CORP. but the short term shows some signs of running out of steam. However, a sale could be considered as long as the price remains below 16.93 USD. Crossing the first support at 16.00 USD would be a sign of a further potential price plummet. Sellers would then use the next support located at 15.57 USD as an objective. Crossing it would then enable sellers to target 14.90 USD. Caution, a return to above the resistance located at 16.93 USD would be a sign of a possible consolidation phase of the short-term basic trend. If this is the case, remember that trading against the trend may be riskier. It would seem more appropriate to wait for a signal indicating reversal of the trend.
Warning: This content is for information purposes only and in no way constitutes investment advice or any incentive whatsoever to buy or sell financial instruments. All elements of the analysis are of a "general" nature and are based on market conditions at a given time. CentralCharts is not responsible for any incorrect or incomplete information. Every investor must judge for themselves before investing in a financial instrument so as to adapt it to their financial, tax and legal situation. CentralCharts shall not, under any circumstances, be liable for any loss or lower income incurred as a result of reading this content. Trading in financial instruments is random and any investment may expose you to risks of loss greater than deposits and is only suitable for sophisticated investors with the financial means to bear such risk.

This analysis was given by Vincent Launay. Take part yourself by sharing additional analysis on another time unit:
Additional analysis
Quotes
The THE AES CORP. price is 16.32 USD. The price registered a decrease of -1.98% on the session with the lowest point at 16.28 USD and the highest point at 16.64 USD. The deviation from the price is +0.25% for the low point and -1.92% for the high point.16.28
16.64
16.32
The Central Gaps scanner detects a bearish opening. A small advantage for sellers in the very short term.
Bearish opening
Type : Bearish
Timeframe : Openning
A study of price movements over other periods shows the following variations:
Technical
Technical analysis of THE AES CORP. in Daily shows a overall strongly bearish trend. The signals given by moving averages are 82.14% bearish. This strongly bearish trend seems to be slowing down given the slightly bearish signals being given by short-term moving averages. The Central Indicators scanner does not detect any result on moving averages that would impact this trend.
The technical indicators are generally neutral. They do not provide relevant information on the direction of future price movements.
Central Indicators, the detector scanner for these technical indicators has recently detected several signals:
Pivot points : price is under support 3
Type : Neutral
Timeframe : Daily
RSI indicator is back over 50
Type : Bullish
Timeframe : Daily
An analysis of the price chart with the Central Patterns scanner (detector of chart patterns and resistances and supports) shows a result that can have an impact on the price change:
Near support of channel
Type : Bullish
Timeframe : Daily
The Central Candlesticks scanner which studies Japanese candlesticks did not detect anything.
ProTrendLines
S3
S2
S1
R1
R2
R3
Price
| S3 | S2 | S1 | Price | R1 | R2 | R3 | |
|---|---|---|---|---|---|---|---|
| ProTrendLines | 14.90 | 15.57 | 16.00 | 16.32 | 16.93 | 17.67 | 18.41 |
| Change (%) | -8.70% | -4.60% | -1.96% | - | +3.74% | +8.27% | +12.81% |
| Change | -1.42 | -0.75 | -0.32 | - | +0.61 | +1.35 | +2.09 |
| Level | Minor | Major | Major | - | Major | Major | Major |
Pivot points can also be used to set your price objectives. Here is the price situation in relation to pivot points:
Daily
| Pivot points | S3 | S2 | S1 | PP | R1 | R2 | R3 |
|---|---|---|---|---|---|---|---|
| Standard | 16.32 | 16.42 | 16.53 | 16.64 | 16.75 | 16.86 | 16.98 |
| Camarilla | 16.59 | 16.61 | 16.63 | 16.65 | 16.67 | 16.69 | 16.71 |
| Woodie | 16.32 | 16.42 | 16.54 | 16.64 | 16.76 | 16.86 | 16.98 |
| Fibonacci | 16.42 | 16.50 | 16.56 | 16.64 | 16.72 | 16.78 | 16.86 |
Weekly
| Pivot points | S3 | S2 | S1 | PP | R1 | R2 | R3 |
|---|---|---|---|---|---|---|---|
| Standard | 15.42 | 15.85 | 16.30 | 16.73 | 17.18 | 17.61 | 18.06 |
| Camarilla | 16.52 | 16.60 | 16.68 | 16.76 | 16.84 | 16.92 | 17.00 |
| Woodie | 15.44 | 15.85 | 16.32 | 16.74 | 17.20 | 17.61 | 18.08 |
| Fibonacci | 15.85 | 16.18 | 16.39 | 16.73 | 17.06 | 17.27 | 17.61 |
Numerical data
The following is the status of technical indicators and moving averages registered at the time this technical analysis was created:
Technical indicators
Moving averages
| RSI (14): | 44.11 | |
| MACD (12,26,9): | 0.0100 | |
| Directional Movement: | -7.44 | |
| AROON (14): | 21.43 | |
| DEMA (21): | 16.61 | |
| Parabolic SAR (0,02-0,02-0,2): | 17.20 | |
| Elder Ray (13): | -0.17 | |
| Super Trend (3,10): | 16.01 | |
| Zig ZAG (10): | 16.32 | |
| VORTEX (21): | 0.9700 | |
| Stochastique (14,3,5): | 31.72 | |
| TEMA (21): | 16.72 | |
| Williams %R (14): | -91.67 | |
| Chande Momentum Oscillator (20): | -0.11 | |
| Repulse (5,40,3): | -3.0700 | |
| ROCnROLL: | 2 | |
| TRIX (15,9): | 0.0200 | |
| Courbe Coppock: | 4.10 |
| MA7: | 16.67 | |
| MA20: | 16.55 | |
| MA50: | 16.68 | |
| MA100: | 17.11 | |
| MAexp7: | 16.62 | |
| MAexp20: | 16.61 | |
| MAexp50: | 16.71 | |
| MAexp100: | 16.59 | |
| Price / MA7: | -2.10% | |
| Price / MA20: | -1.39% | |
| Price / MA50: | -2.16% | |
| Price / MA100: | -4.62% | |
| Price / MAexp7: | -1.81% | |
| Price / MAexp20: | -1.75% | |
| Price / MAexp50: | -2.33% | |
| Price / MAexp100: | -1.63% |
News
Don"t forget to follow the news on THE AES CORP.. At the time of publication of this analysis, the latest news was as follows:
- AES Corporation to Host Earnings Call
- Apollo Enterprise Solutions, Ltd. (“AES”) (AES:BH, OAL:GR) Launches TrueWealthManager™ System in Europe
- SDG&E and AES Energy Storage Unveil World's Largest Lithium Ion Battery-Based Energy Storage Installation
-
 AES
AES
- Measure Partners With AES To Deploy Drones At Record Scale For The Energy Industry
This member declared not having a position on this financial instrument or a related financial instrument.
About author

Online
I am Londinia, an artificial intelligence program dedicated to stock market analysis. I am able to analyse and interpret graphical and market data. Learn more…


Add a comment
Comments
0 comments on the analysis THE AES CORP. - Daily