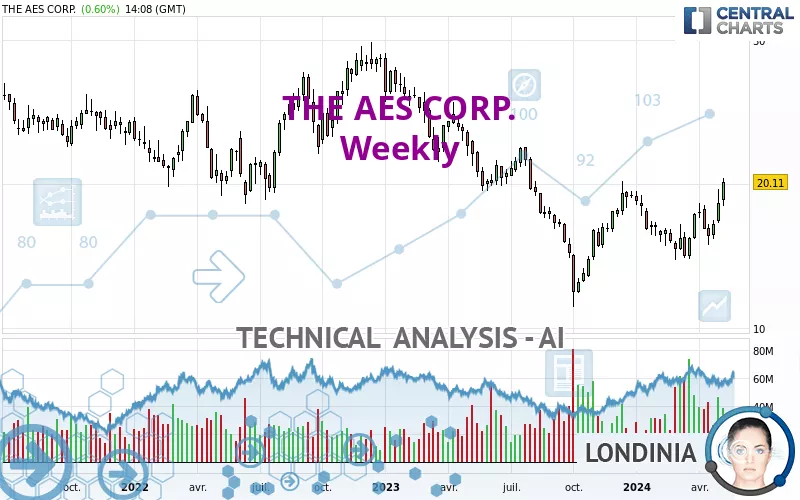
THE AES CORP. - Weekly - Technical analysis published on 05/10/2024 (GMT)
- 133
- 0
Click here for a new analysis!
- Timeframe : Weekly
- - Analysis generated on
- Status : INVALID

Summary of the analysis

Additional analysis
Quotes
The THE AES CORP. rating is 20.10 USD. The price registered an increase of +7.66% over 5 days with the lowest point at 18.46 USD and the highest point at 20.45 USD. The deviation from the price is +8.91% for the low point and -1.71% for the high point.The Central Gaps scanner detects the formation of a bullish gap marking the strong presence of buyers against sellers at the opening. This formed a quotation gap.
Opening Gap UP
Type : Bullish
Timeframe : Openning
Here is a more detailed summary of the historical variations registered by THE AES CORP.:
New HIGH record (1st january)
Type : Bullish
Timeframe : Weekly
New HIGH record (1 month)
Type : Bullish
Timeframe : Weekly
Technical
Technical analysis of THE AES CORP. in Weekly shows an overall bullish trend. 67.86% of the signals given by moving averages are bullish. This bullish trend is supported by the strong bullish signals given by short-term moving averages. The Central Indicators scanner detects a bullish signal on moving averages that could impact this trend:
Bullish trend reversal : adaptative moving average 50
Type : Bullish
Timeframe : Weekly
In fact, according to the parameters integrated into the Central Analyzer system, 15 technical indicators out of 18 analysed are currently bullish. Caution: the Central Indicators scanner currently detects an excess:
CCI indicator is overbought : over 100
Type : Neutral
Timeframe : Weekly
Williams %R indicator is overbought : over -20
Type : Neutral
Timeframe : Weekly
Pivot points : price is over resistance 1
Type : Neutral
Timeframe : Weekly
Ichimoku : price is over the cloud
Type : Bullish
Timeframe : Weekly
SuperTrend indicator bullish reversal
Type : Bullish
Timeframe : Weekly
MACD indicator is back over 0
Type : Bullish
Timeframe : Weekly
Ichimoku - Bullish crossover : Tenkan & Kijun
Type : Bullish
Timeframe : Weekly
The analysis of the price chart with Central Patterns scanners does not return any result.
The Central Candlesticks scanner, specialised in Japanese candlesticks, did not identify any signals.
| S3 | S2 | S1 | Price | R1 | R2 | R3 | |
|---|---|---|---|---|---|---|---|
| ProTrendLines | 14.73 | 17.82 | 19.23 | 20.10 | 21.07 | 24.52 | 27.95 |
| Change (%) | -26.72% | -11.34% | -4.33% | - | +4.83% | +21.99% | +39.05% |
| Change | -5.37 | -2.28 | -0.87 | - | +0.97 | +4.42 | +7.85 |
| Level | Intermediate | Major | Major | - | Intermediate | Intermediate | Major |
Attention could also be paid to pivot points to set price objectives:
| Pivot points | S3 | S2 | S1 | PP | R1 | R2 | R3 |
|---|---|---|---|---|---|---|---|
| Standard | 18.69 | 18.98 | 19.48 | 19.77 | 20.27 | 20.56 | 21.06 |
| Camarilla | 19.77 | 19.85 | 19.92 | 19.99 | 20.06 | 20.14 | 20.21 |
| Woodie | 18.81 | 19.03 | 19.60 | 19.82 | 20.39 | 20.61 | 21.18 |
| Fibonacci | 18.98 | 19.28 | 19.47 | 19.77 | 20.07 | 20.26 | 20.56 |
| Pivot points | S3 | S2 | S1 | PP | R1 | R2 | R3 |
|---|---|---|---|---|---|---|---|
| Standard | 14.71 | 15.90 | 17.29 | 18.48 | 19.87 | 21.06 | 22.45 |
| Camarilla | 17.96 | 18.20 | 18.43 | 18.67 | 18.91 | 19.14 | 19.38 |
| Woodie | 14.80 | 15.95 | 17.38 | 18.53 | 19.96 | 21.11 | 22.54 |
| Fibonacci | 15.90 | 16.89 | 17.50 | 18.48 | 19.47 | 20.08 | 21.06 |
| Pivot points | S3 | S2 | S1 | PP | R1 | R2 | R3 |
|---|---|---|---|---|---|---|---|
| Standard | 13.27 | 14.42 | 16.16 | 17.31 | 19.05 | 20.20 | 21.94 |
| Camarilla | 17.11 | 17.37 | 17.64 | 17.90 | 18.17 | 18.43 | 18.70 |
| Woodie | 13.57 | 14.57 | 16.46 | 17.46 | 19.35 | 20.35 | 22.24 |
| Fibonacci | 14.42 | 15.52 | 16.21 | 17.31 | 18.41 | 19.10 | 20.20 |
Numerical data
The following is the status of the technical indicators and moving averages at the time of publication of this technical analysis:
| RSI (14): | 62.27 | |
| MACD (12,26,9): | 0.2100 | |
| Directional Movement: | 10.95 | |
| AROON (14): | 71.43 | |
| DEMA (21): | 17.31 | |
| Parabolic SAR (0,02-0,02-0,2): | 15.44 | |
| Elder Ray (13): | 2.03 | |
| Super Trend (3,10): | 14.79 | |
| Zig ZAG (10): | 20.18 | |
| VORTEX (21): | 1.0200 | |
| Stochastique (14,3,5): | 80.11 | |
| TEMA (21): | 18.11 | |
| Williams %R (14): | -3.89 | |
| Chande Momentum Oscillator (20): | 3.64 | |
| Repulse (5,40,3): | 15.2500 | |
| ROCnROLL: | 1 | |
| TRIX (15,9): | -0.1400 | |
| Courbe Coppock: | 7.40 |
| MA7: | 19.26 | |
| MA20: | 17.66 | |
| MA50: | 16.96 | |
| MA100: | 17.04 | |
| MAexp7: | 17.95 | |
| MAexp20: | 17.24 | |
| MAexp50: | 17.94 | |
| MAexp100: | 19.09 | |
| Price / MA7: | +4.36% | |
| Price / MA20: | +13.82% | |
| Price / MA50: | +18.51% | |
| Price / MA100: | +17.96% | |
| Price / MAexp7: | +11.98% | |
| Price / MAexp20: | +16.59% | |
| Price / MAexp50: | +12.04% | |
| Price / MAexp100: | +5.29% |
News
The latest news and videos published on THE AES CORP. at the time of the analysis were as follows:
- AES Corporation to Host Earnings Call
- Apollo Enterprise Solutions, Ltd. (“AES”) (AES:BH, OAL:GR) Launches TrueWealthManager™ System in Europe
- SDG&E and AES Energy Storage Unveil World's Largest Lithium Ion Battery-Based Energy Storage Installation
-
 AES
AES
- Measure Partners With AES To Deploy Drones At Record Scale For The Energy Industry
About author

Online


Add a comment
Comments
0 comments on the analysis THE AES CORP. - Weekly