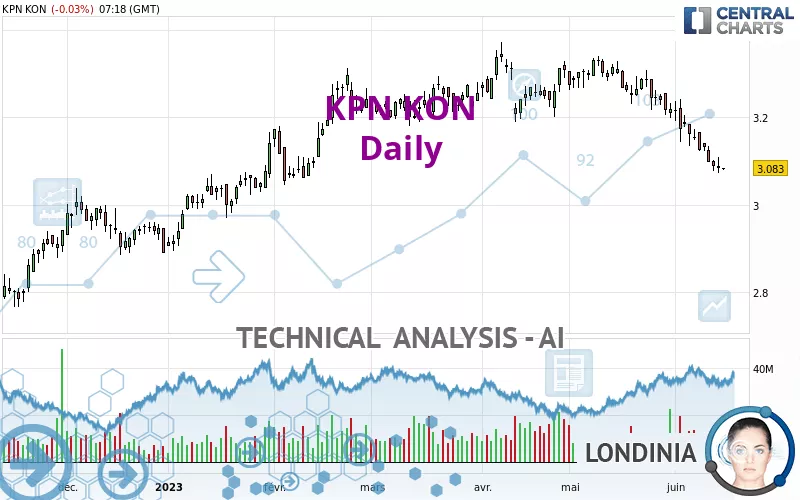
KPN KON - Daily - Technical analysis published on 06/15/2023 (GMT)
- 111
- 0
Click here for a new analysis!
- Timeframe : Daily
- - Analysis generated on
- Status : INVALID
Summary of the analysis

Additional analysis
Quotes
The KPN KON price is 3.083 EUR. On the day, this instrument lost -0.03% and was between 3.079 EUR and 3.085 EUR. This implies that the price is at +0.13% from its lowest and at -0.06% from its highest.A study of price movements over other periods shows the following variations:
Near a new LOW record (1 month)
Type : Bearish
Timeframe : Weekly
Technical
Technical analysis of KPN KON in Daily shows an overall bearish trend. 67.86% of the signals given by moving averages are bearish. This bearish trend is supported by the strong bearish signals given by short-term moving averages. There is no crossing of moving average by the price or crossing of moving averages between themselves.
In fact, 11 technical indicators on 18 studied are currently bearish. Caution: the Central Indicators scanner currently detects an excess:
RSI indicator is oversold : under 30
Type : Neutral
Timeframe : Daily
CCI indicator is oversold : under -100
Type : Neutral
Timeframe : Daily
Williams %R indicator is oversold : under -80
Type : Neutral
Timeframe : Daily
Pivot points : price is under support 1
Type : Neutral
Timeframe : Weekly
The Central Patterns scanner, which studies chart patterns, resistances and supports, has identified this signal:
Near support of channel
Type : Bullish
Timeframe : Daily
No result was found by the Central Candlesticks scanner on Japanese candlesticks.
| S3 | S2 | S1 | Price | R1 | R2 | R3 | |
|---|---|---|---|---|---|---|---|
| ProTrendLines | 2.610 | 2.807 | 2.920 | 3.083 | 3.108 | 3.249 | 3.310 |
| Change (%) | -15.34% | -8.95% | -5.29% | - | +0.81% | +5.38% | +7.36% |
| Change | -0.473 | -0.276 | -0.163 | - | +0.025 | +0.166 | +0.227 |
| Level | Major | Intermediate | Major | - | Major | Major | Major |
To determine price objectives, it is also possible to use the pivot points. Here is the price position in relation to pivot points:
| Pivot points | S3 | S2 | S1 | PP | R1 | R2 | R3 |
|---|---|---|---|---|---|---|---|
| Standard | 3.031 | 3.051 | 3.068 | 3.088 | 3.105 | 3.125 | 3.142 |
| Camarilla | 3.074 | 3.077 | 3.081 | 3.084 | 3.087 | 3.091 | 3.094 |
| Woodie | 3.029 | 3.050 | 3.066 | 3.087 | 3.103 | 3.124 | 3.140 |
| Fibonacci | 3.051 | 3.066 | 3.074 | 3.088 | 3.103 | 3.111 | 3.125 |
| Pivot points | S3 | S2 | S1 | PP | R1 | R2 | R3 |
|---|---|---|---|---|---|---|---|
| Standard | 3.017 | 3.069 | 3.101 | 3.153 | 3.185 | 3.237 | 3.269 |
| Camarilla | 3.109 | 3.117 | 3.124 | 3.132 | 3.140 | 3.147 | 3.155 |
| Woodie | 3.006 | 3.064 | 3.090 | 3.148 | 3.174 | 3.232 | 3.258 |
| Fibonacci | 3.069 | 3.101 | 3.121 | 3.153 | 3.185 | 3.205 | 3.237 |
| Pivot points | S3 | S2 | S1 | PP | R1 | R2 | R3 |
|---|---|---|---|---|---|---|---|
| Standard | 3.023 | 3.111 | 3.164 | 3.252 | 3.305 | 3.393 | 3.446 |
| Camarilla | 3.179 | 3.192 | 3.205 | 3.218 | 3.231 | 3.244 | 3.257 |
| Woodie | 3.007 | 3.102 | 3.148 | 3.243 | 3.289 | 3.384 | 3.430 |
| Fibonacci | 3.111 | 3.165 | 3.198 | 3.252 | 3.306 | 3.339 | 3.393 |
Numerical data
The following is the status of technical indicators and moving averages registered at the time this technical analysis was created:
| RSI (14): | 23.59 | |
| MACD (12,26,9): | -0.0450 | |
| Directional Movement: | -25.099 | |
| AROON (14): | -92.857 | |
| DEMA (21): | 3.117 | |
| Parabolic SAR (0,02-0,02-0,2): | 3.144 | |
| Elder Ray (13): | -0.060 | |
| Super Trend (3,10): | 3.187 | |
| Zig ZAG (10): | 3.082 | |
| VORTEX (21): | 0.7620 | |
| Stochastique (14,3,5): | 5.14 | |
| TEMA (21): | 3.075 | |
| Williams %R (14): | -95.11 | |
| Chande Momentum Oscillator (20): | -0.135 | |
| Repulse (5,40,3): | -1.3440 | |
| ROCnROLL: | 2 | |
| TRIX (15,9): | -0.1450 | |
| Courbe Coppock: | 8.86 |
| MA7: | 3.109 | |
| MA20: | 3.187 | |
| MA50: | 3.235 | |
| MA100: | 3.166 | |
| MAexp7: | 3.110 | |
| MAexp20: | 3.168 | |
| MAexp50: | 3.194 | |
| MAexp100: | 3.155 | |
| Price / MA7: | -0.84% | |
| Price / MA20: | -3.26% | |
| Price / MA50: | -4.70% | |
| Price / MA100: | -2.62% | |
| Price / MAexp7: | -0.87% | |
| Price / MAexp20: | -2.68% | |
| Price / MAexp50: | -3.48% | |
| Price / MAexp100: | -2.28% |
News
The last news published on KPN KON at the time of the generation of this analysis was as follows:
- Press release: KPN completes € 300m share buyback
- Press release: KPN reports on progress of € 300m share buyback
- Press Release: KPN EGM approves appointments of Supervisory Board and Board of Management members
- Press release: KPN reports on progress of € 300m share buyback
- Press release: KPN reports on progress of € 300m share buyback
About author
Online


Add a comment
Comments
0 comments on the analysis KPN KON - Daily