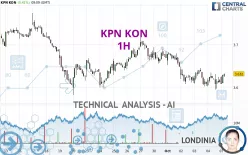
KPN KON - 1H - Technical analysis published on 10/07/2024 (GMT)
- 129
- 0
Click here for a new analysis!
- Timeframe : 1H
- - Analysis generated on
- Status : INVALID

Summary of the analysis

Additional analysis
Quotes
KPN KON rating 3.632 EUR. On the day, this instrument gained +0.42% with the lowest point at 3.608 EUR and the highest point at 3.632 EUR. The deviation from the price is +0.67% for the low point and 0% for the high point.The Central Gaps scanner detects a bullish opening. A small advantage for buyers in the very short term.
Bullish opening
Type : Bullish
Timeframe : Openning
So that you have an overall view of the price change, here is a table showing the variations over several periods:
Near a new HIGH record (5 years)
Type : Bullish
Timeframe : Weekly
Near a new HIGH record (1 year)
Type : Bullish
Timeframe : Weekly
Near a new HIGH record (1st january)
Type : Bullish
Timeframe : Weekly
Near a new HIGH record (1 month)
Type : Bullish
Timeframe : Weekly
Technical
A technical analysis in 1H of this KPN KON chart shows a bearish trend. 78.57% of the signals given by moving averages are bearish. Caution: the neutral signals currently given by short-term moving averages show us that the global trend is losing momentum. The Central Indicators scanner detects bullish signals on moving averages that could impact this trend:
Bullish trend reversal : Moving Average 20
Type : Bullish
Timeframe : 1 hour
Bullish trend reversal : adaptative moving average 20
Type : Bullish
Timeframe : 1 hour
In fact, Central Analyzer took into account 18 technical indicators and the result was as follows: 5 are bullish, 3 are neutral and 10 are bearish. Caution: the Central Indicators scanner currently detects an excess:
Williams %R indicator is overbought : over -20
Type : Neutral
Timeframe : 1 hour
RSI indicator is back over 50
Type : Bullish
Timeframe : 1 hour
Parabolic SAR indicator bullish reversal
Type : Bullish
Timeframe : 1 hour
Momentum indicator is back over 0
Type : Bullish
Timeframe : 1 hour
Central Patterns, the market scanner focusing on chart patterns, resistances and supports found these results:
Near resistance of channel
Type : Bearish
Timeframe : 1 hour
Near support of triangle
Type : Bullish
Timeframe : 1 hour
The Central Candlesticks scanner, specialised in Japanese candlesticks, did not identify any signals.
| S3 | S2 | S1 | Price | R1 | R2 | R3 | |
|---|---|---|---|---|---|---|---|
| ProTrendLines | 3.530 | 3.582 | 3.607 | 3.632 | 3.668 | 3.701 | 3.720 |
| Change (%) | -2.81% | -1.38% | -0.69% | - | +0.99% | +1.90% | +2.42% |
| Change | -0.102 | -0.050 | -0.025 | - | +0.036 | +0.069 | +0.088 |
| Level | Minor | Minor | Major | - | Minor | Major | Minor |
Pivot points can also be used to set your price objectives. Here is the price situation in relation to pivot points:
| Pivot points | S3 | S2 | S1 | PP | R1 | R2 | R3 |
|---|---|---|---|---|---|---|---|
| Standard | 3.556 | 3.576 | 3.596 | 3.616 | 3.636 | 3.656 | 3.676 |
| Camarilla | 3.606 | 3.610 | 3.613 | 3.617 | 3.621 | 3.624 | 3.628 |
| Woodie | 3.557 | 3.576 | 3.597 | 3.616 | 3.637 | 3.656 | 3.677 |
| Fibonacci | 3.576 | 3.591 | 3.600 | 3.616 | 3.631 | 3.640 | 3.656 |
| Pivot points | S3 | S2 | S1 | PP | R1 | R2 | R3 |
|---|---|---|---|---|---|---|---|
| Standard | 3.478 | 3.536 | 3.577 | 3.635 | 3.676 | 3.734 | 3.775 |
| Camarilla | 3.590 | 3.599 | 3.608 | 3.617 | 3.626 | 3.635 | 3.644 |
| Woodie | 3.469 | 3.532 | 3.568 | 3.631 | 3.667 | 3.730 | 3.766 |
| Fibonacci | 3.536 | 3.574 | 3.598 | 3.635 | 3.673 | 3.697 | 3.734 |
| Pivot points | S3 | S2 | S1 | PP | R1 | R2 | R3 |
|---|---|---|---|---|---|---|---|
| Standard | 3.375 | 3.478 | 3.574 | 3.677 | 3.773 | 3.876 | 3.972 |
| Camarilla | 3.614 | 3.633 | 3.651 | 3.669 | 3.687 | 3.706 | 3.724 |
| Woodie | 3.371 | 3.476 | 3.570 | 3.675 | 3.769 | 3.874 | 3.968 |
| Fibonacci | 3.478 | 3.554 | 3.601 | 3.677 | 3.753 | 3.800 | 3.876 |
Numerical data
The following are the details of the technical indicators and moving averages that were collected to generate this technical analysis:
| RSI (14): | 42.01 | |
| MACD (12,26,9): | -0.0080 | |
| Directional Movement: | -8.080 | |
| AROON (14): | -64.286 | |
| DEMA (21): | 3.609 | |
| Parabolic SAR (0,02-0,02-0,2): | 3.626 | |
| Elder Ray (13): | -0.005 | |
| Super Trend (3,10): | 3.650 | |
| Zig ZAG (10): | 3.612 | |
| VORTEX (21): | 0.9900 | |
| Stochastique (14,3,5): | 39.12 | |
| TEMA (21): | 3.610 | |
| Williams %R (14): | -57.50 | |
| Chande Momentum Oscillator (20): | -0.002 | |
| Repulse (5,40,3): | -0.3520 | |
| ROCnROLL: | 2 | |
| TRIX (15,9): | -0.0350 | |
| Courbe Coppock: | 0.64 |
| MA7: | 3.636 | |
| MA20: | 3.670 | |
| MA50: | 3.644 | |
| MA100: | 3.574 | |
| MAexp7: | 3.614 | |
| MAexp20: | 3.620 | |
| MAexp50: | 3.635 | |
| MAexp100: | 3.650 | |
| Price / MA7: | -0.11% | |
| Price / MA20: | -1.04% | |
| Price / MA50: | -0.33% | |
| Price / MA100: | +1.62% | |
| Price / MAexp7: | +0.50% | |
| Price / MAexp20: | +0.33% | |
| Price / MAexp50: | -0.08% | |
| Price / MAexp100: | -0.49% |
News
The last news published on KPN KON at the time of the generation of this analysis was as follows:
- KPN EGM approves appointment of Rob Shuter to Supervisory Board
- KPN calls EGM to appoint Mr Rob Shuter to the Supervisory Board
- KPN continues to deliver on strategic and financial objectives
- KPN nominates Rob Shuter to Supervisory Board
- KPN obtains 100 MHz in 3.5 GHz spectrum auction
About author
Online


Add a comment
Comments
0 comments on the analysis KPN KON - 1H