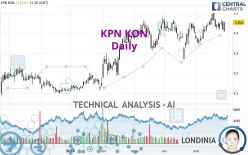
KPN KON - Daily - Technical analysis published on 05/29/2024 (GMT)
- 144
- 0
Click here for a new analysis!
- Timeframe : Daily
- - Analysis generated on
- Status : TARGET REACHED

Summary of the analysis

Additional analysis
Quotes
The KPN KON price is 3.454 EUR. On the day, this instrument gained +1.11% with the lowest point at 3.409 EUR and the highest point at 3.457 EUR. The deviation from the price is +1.32% for the low point and -0.09% for the high point.The Central Gaps scanner detects a bearish gap which is a sign that the sellers have taken the lead in the very short term.
Opening Gap DOWN
Type : Bearish
Timeframe : Openning
So that you have an overall view of the price change, here is a table showing the variations over several periods:
Near a new HIGH record (5 years)
Type : Bullish
Timeframe : Weekly
Near a new HIGH record (1 year)
Type : Bullish
Timeframe : Weekly
Near a new HIGH record (1st january)
Type : Bullish
Timeframe : Weekly
Near a new LOW record (1 month)
Type : Bearish
Timeframe : Weekly
Technical
Technical analysis of this Daily chart of KPN KON indicates that the overall trend is strongly bullish. 92.86% of the signals given by moving averages are bullish. The overall trend is supported by the strong bullish signals from short-term moving averages. An assessment of moving averages reveals a bullish signal that could impact this trend:
Bullish price crossover with Moving Average 20
Type : Bullish
Timeframe : Daily
An assessment of technical indicators shows a slightly bullish signal.
Other results related to technical indicators were also found by the Central Indicators scanner:
Pivot points : price is over resistance 1
Type : Neutral
Timeframe : Daily
Price is back over the pivot point
Type : Bullish
Timeframe : Weekly
Williams %R indicator is back over -50
Type : Bullish
Timeframe : Daily
The Central Patterns scanner, which studies chart patterns, resistances and supports, has identified this signal:
Horizontal resistance is broken
Type : Bullish
Timeframe : Daily
The presence of a bullish Japanese candlestick pattern detected by Central Candlesticks that could cause a very short term rebound was also detected:
Piercing line
Type : Bullish
Timeframe : Daily
| S3 | S2 | S1 | Price | R1 | |
|---|---|---|---|---|---|
| ProTrendLines | 3.274 | 3.347 | 3.433 | 3.454 | 3.494 |
| Change (%) | -5.21% | -3.10% | -0.61% | - | +1.16% |
| Change | -0.180 | -0.107 | -0.021 | - | +0.040 |
| Level | Minor | Intermediate | Intermediate | - | Major |
Attention could also be paid to pivot points to set price objectives:
| Pivot points | S3 | S2 | S1 | PP | R1 | R2 | R3 |
|---|---|---|---|---|---|---|---|
| Standard | 3.355 | 3.385 | 3.401 | 3.431 | 3.447 | 3.477 | 3.493 |
| Camarilla | 3.403 | 3.408 | 3.412 | 3.416 | 3.420 | 3.424 | 3.429 |
| Woodie | 3.347 | 3.382 | 3.393 | 3.428 | 3.439 | 3.474 | 3.485 |
| Fibonacci | 3.385 | 3.403 | 3.414 | 3.431 | 3.449 | 3.460 | 3.477 |
| Pivot points | S3 | S2 | S1 | PP | R1 | R2 | R3 |
|---|---|---|---|---|---|---|---|
| Standard | 3.318 | 3.365 | 3.405 | 3.452 | 3.492 | 3.539 | 3.579 |
| Camarilla | 3.420 | 3.428 | 3.436 | 3.444 | 3.452 | 3.460 | 3.468 |
| Woodie | 3.314 | 3.363 | 3.401 | 3.450 | 3.488 | 3.537 | 3.575 |
| Fibonacci | 3.365 | 3.399 | 3.419 | 3.452 | 3.486 | 3.506 | 3.539 |
| Pivot points | S3 | S2 | S1 | PP | R1 | R2 | R3 |
|---|---|---|---|---|---|---|---|
| Standard | 3.101 | 3.180 | 3.294 | 3.373 | 3.487 | 3.566 | 3.680 |
| Camarilla | 3.355 | 3.373 | 3.390 | 3.408 | 3.426 | 3.443 | 3.461 |
| Woodie | 3.119 | 3.189 | 3.312 | 3.382 | 3.505 | 3.575 | 3.698 |
| Fibonacci | 3.180 | 3.254 | 3.299 | 3.373 | 3.447 | 3.492 | 3.566 |
Numerical data
The following is the status of technical indicators and moving averages registered at the time this technical analysis was created:
| RSI (14): | 57.97 | |
| MACD (12,26,9): | 0.0230 | |
| Directional Movement: | 4.459 | |
| AROON (14): | 50.000 | |
| DEMA (21): | 3.459 | |
| Parabolic SAR (0,02-0,02-0,2): | 3.487 | |
| Elder Ray (13): | -0.004 | |
| Super Trend (3,10): | 3.379 | |
| Zig ZAG (10): | 3.455 | |
| VORTEX (21): | 0.9710 | |
| Stochastique (14,3,5): | 50.99 | |
| TEMA (21): | 3.455 | |
| Williams %R (14): | -47.37 | |
| Chande Momentum Oscillator (20): | 0.017 | |
| Repulse (5,40,3): | 0.7770 | |
| ROCnROLL: | 1 | |
| TRIX (15,9): | 0.1180 | |
| Courbe Coppock: | 2.79 |
| MA7: | 3.439 | |
| MA20: | 3.425 | |
| MA50: | 3.365 | |
| MA100: | 3.271 | |
| MAexp7: | 3.442 | |
| MAexp20: | 3.426 | |
| MAexp50: | 3.372 | |
| MAexp100: | 3.299 | |
| Price / MA7: | +0.44% | |
| Price / MA20: | +0.85% | |
| Price / MA50: | +2.64% | |
| Price / MA100: | +5.59% | |
| Price / MAexp7: | +0.35% | |
| Price / MAexp20: | +0.82% | |
| Price / MAexp50: | +2.43% | |
| Price / MAexp100: | +4.70% |
News
The latest news and videos published on KPN KON at the time of the analysis were as follows:
- KPN reports on progress of € 200m share buyback
- KPN reports on progress of € 200m share buyback
- KPN reports on progress of € 200m share buyback
- KPN reports on progress of € 200m share buyback
- KPN reports on progress of € 200m share buyback
About author
Online


Add a comment
Comments
0 comments on the analysis KPN KON - Daily