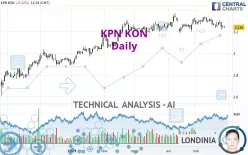
KPN KON - Daily - Technical analysis published on 05/29/2023 (GMT)
- 169
- 0
Click here for a new analysis!
- Timeframe : Daily
- - Analysis generated on
- Status : LEVEL MAINTAINED

Summary of the analysis

Additional analysis
Quotes
The KPN KON rating is 3.239 EUR. The price registered a decrease of -0.12% on the session and was between 3.237 EUR and 3.253 EUR. This implies that the price is at +0.06% from its lowest and at -0.43% from its highest.A bullish opening was detected by the Central Gaps scanner. Buyers are trying to impose a bullish momentum in the very short term.
Bullish opening
Type : Bullish
Timeframe : Openning
So that you have an overall view of the price change, here is a table showing the variations over several periods:
Near a new HIGH record (5 years)
Type : Bullish
Timeframe : Weekly
Near a new HIGH record (1 year)
Type : Bullish
Timeframe : Weekly
Near a new HIGH record (1st january)
Type : Bullish
Timeframe : Weekly
Near a new HIGH record (1 month)
Type : Bullish
Timeframe : Weekly
Technical
A technical analysis in Daily of this KPN KON chart shows a bullish trend. 71.43% of the signals given by moving averages are bullish. Caution: the neutral signals currently given by short-term moving averages show us that the global trend is losing momentum. The Central Indicators scanner does not detect any result on moving averages that would impact this trend.
In fact, according to the parameters integrated into the Central Analyzer system, 11 technical indicators out of 18 analysed are currently bearish. Caution: the Central Indicators scanner currently detects an excess:
CCI indicator is oversold : under -100
Type : Neutral
Timeframe : Daily
Williams %R indicator is oversold : under -80
Type : Neutral
Timeframe : Daily
Ichimoku - Bearish crossover : Tenkan & Kijun
Type : Bearish
Timeframe : Daily
Price is back under the pivot point
Type : Bearish
Timeframe : Daily
No signals are given by Central Patterns, a market scanner specialised in chart patterns, resistances and supports.
The Central Candlesticks scanner which studies Japanese candlesticks did not detect anything.
| S3 | S2 | S1 | Price | R1 | R2 | |
|---|---|---|---|---|---|---|
| ProTrendLines | 2.610 | 2.807 | 2.917 | 3.239 | 3.249 | 3.310 |
| Change (%) | -19.42% | -13.34% | -9.94% | - | +0.31% | +2.19% |
| Change | -0.629 | -0.432 | -0.322 | - | +0.010 | +0.071 |
| Level | Major | Intermediate | Minor | - | Intermediate | Major |
To determine price objectives, it is also possible to use the pivot points. Here is the price position in relation to pivot points:
| Pivot points | S3 | S2 | S1 | PP | R1 | R2 | R3 |
|---|---|---|---|---|---|---|---|
| Standard | 3.193 | 3.210 | 3.227 | 3.244 | 3.261 | 3.278 | 3.295 |
| Camarilla | 3.234 | 3.237 | 3.240 | 3.243 | 3.246 | 3.249 | 3.252 |
| Woodie | 3.192 | 3.210 | 3.226 | 3.244 | 3.260 | 3.278 | 3.294 |
| Fibonacci | 3.210 | 3.223 | 3.231 | 3.244 | 3.257 | 3.265 | 3.278 |
| Pivot points | S3 | S2 | S1 | PP | R1 | R2 | R3 |
|---|---|---|---|---|---|---|---|
| Standard | 3.110 | 3.163 | 3.203 | 3.256 | 3.296 | 3.349 | 3.389 |
| Camarilla | 3.217 | 3.226 | 3.235 | 3.243 | 3.252 | 3.260 | 3.269 |
| Woodie | 3.104 | 3.160 | 3.197 | 3.253 | 3.290 | 3.346 | 3.383 |
| Fibonacci | 3.163 | 3.199 | 3.221 | 3.256 | 3.292 | 3.314 | 3.349 |
| Pivot points | S3 | S2 | S1 | PP | R1 | R2 | R3 |
|---|---|---|---|---|---|---|---|
| Standard | 3.016 | 3.082 | 3.196 | 3.262 | 3.376 | 3.442 | 3.556 |
| Camarilla | 3.260 | 3.276 | 3.293 | 3.309 | 3.326 | 3.342 | 3.359 |
| Woodie | 3.039 | 3.094 | 3.219 | 3.274 | 3.399 | 3.454 | 3.579 |
| Fibonacci | 3.082 | 3.151 | 3.194 | 3.262 | 3.331 | 3.374 | 3.442 |
Numerical data
The following are the details of the technical indicators and moving averages that were collected to generate this technical analysis:
| RSI (14): | 44.20 | |
| MACD (12,26,9): | 0.0020 | |
| Directional Movement: | -7.224 | |
| AROON (14): | -78.571 | |
| DEMA (21): | 3.278 | |
| Parabolic SAR (0,02-0,02-0,2): | 3.307 | |
| Elder Ray (13): | -0.022 | |
| Super Trend (3,10): | 3.213 | |
| Zig ZAG (10): | 3.240 | |
| VORTEX (21): | 0.9640 | |
| Stochastique (14,3,5): | 21.41 | |
| TEMA (21): | 3.255 | |
| Williams %R (14): | -82.11 | |
| Chande Momentum Oscillator (20): | -0.064 | |
| Repulse (5,40,3): | -1.1520 | |
| ROCnROLL: | -1 | |
| TRIX (15,9): | 0.0570 | |
| Courbe Coppock: | 2.81 |
| MA7: | 3.259 | |
| MA20: | 3.285 | |
| MA50: | 3.236 | |
| MA100: | 3.138 | |
| MAexp7: | 3.257 | |
| MAexp20: | 3.268 | |
| MAexp50: | 3.230 | |
| MAexp100: | 3.157 | |
| Price / MA7: | -0.61% | |
| Price / MA20: | -1.40% | |
| Price / MA50: | +0.09% | |
| Price / MA100: | +3.22% | |
| Price / MAexp7: | -0.55% | |
| Price / MAexp20: | -0.89% | |
| Price / MAexp50: | +0.28% | |
| Price / MAexp100: | +2.60% |
News
The latest news and videos published on KPN KON at the time of the analysis were as follows:
- Press release: KPN reports on progress of € 300m share buyback
- Press Release: KPN reports on progress of € 300m share buyback
- Press release: KPN reports on progress of € 300m share buyback
- Press release: KPN reports on progress of € 300m share buyback
- Q1 2023 Press Release: KPN delivers continued Group service revenue growth
About author
Online


Add a comment
Comments
0 comments on the analysis KPN KON - Daily