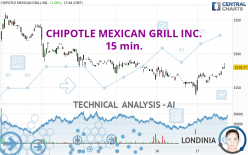
CHIPOTLE MEXICAN GRILL INC. - 15 min. - Technical analysis published on 05/17/2024 (GMT)
- 78
- 0
Click here for a new analysis!
- Timeframe : 15 min.
- - Analysis generated on
- Status : TARGET REACHED

Summary of the analysis

Additional analysis
Quotes
CHIPOTLE MEXICAN GRILL INC. rating 3,177.50 USD. On the day, this instrument gained +1.01% and was between 3,145.23 USD and 3,180.00 USD. This implies that the price is at +1.03% from its lowest and at -0.08% from its highest.The Central Gaps scanner detects a bearish opening. A small advantage for sellers in the very short term.
Bearish opening
Type : Bearish
Timeframe : Openning
Here is a more detailed summary of the historical variations registered by CHIPOTLE MEXICAN GRILL INC.:
Near a new HIGH record (5 years)
Type : Bullish
Timeframe : Weekly
Near a new HIGH record (1 year)
Type : Bullish
Timeframe : Weekly
Near a new HIGH record (1st january)
Type : Bullish
Timeframe : Weekly
Near a new HIGH record (1 month)
Type : Bullish
Timeframe : Weekly
Technical
Technical analysis of CHIPOTLE MEXICAN GRILL INC. in 15 min. shows a neutral overall trend. The trend could quickly turn bullish due to the strong bullish signals currently being given by short-term moving averages. The Central Indicators market scanner currently does not detect any result that concerns moving averages.
In fact, according to the parameters integrated into the Central Analyzer system, 10 technical indicators out of 18 analysed are currently bullish. But beware of excesses. The Central Indicators scanner currently detects this:
RSI indicator: bearish divergence
Type : Bearish
Timeframe : 15 minutes
Pivot points : price is under support 1
Type : Neutral
Timeframe : Weekly
Aroon indicator bearish trend
Type : Bearish
Timeframe : 15 minutes
Momentum indicator is back under 0
Type : Bearish
Timeframe : 15 minutes
The Central Patterns scanner, which studies chart patterns, resistances and supports, has identified these signals:
Near horizontal resistance
Type : Bearish
Timeframe : 15 minutes
Resistance of channel is broken
Type : Bullish
Timeframe : 15 minutes
The presence of these bearish patterns in Japanese candlesticks detected by Central Candlesticks that could cause a correction in the very short term were also noted
Black evening star
Type : Bearish
Timeframe : 15 minutes
Abandoned baby evening star
Type : Bearish
Timeframe : 15 minutes
| S3 | S2 | S1 | Price | R1 | R2 | |
|---|---|---|---|---|---|---|
| ProTrendLines | 3,001.04 | 3,118.66 | 3,169.00 | 3,177.50 | 3,209.47 | 3,241.71 |
| Change (%) | -5.55% | -1.85% | -0.27% | - | +1.01% | +2.02% |
| Change | -176.46 | -58.84 | -8.50 | - | +31.97 | +64.21 |
| Level | Intermediate | Intermediate | Intermediate | - | Intermediate | Minor |
Pivot points can also be used to set your price objectives. Here is the price situation in relation to pivot points:
| Pivot points | S3 | S2 | S1 | PP | R1 | R2 | R3 |
|---|---|---|---|---|---|---|---|
| Standard | 3,086.50 | 3,112.49 | 3,129.19 | 3,155.18 | 3,171.88 | 3,197.87 | 3,214.57 |
| Camarilla | 3,134.14 | 3,138.05 | 3,141.97 | 3,145.88 | 3,149.79 | 3,153.71 | 3,157.62 |
| Woodie | 3,081.85 | 3,110.17 | 3,124.54 | 3,152.86 | 3,167.23 | 3,195.55 | 3,209.92 |
| Fibonacci | 3,112.49 | 3,128.80 | 3,138.88 | 3,155.18 | 3,171.49 | 3,181.57 | 3,197.87 |
| Pivot points | S3 | S2 | S1 | PP | R1 | R2 | R3 |
|---|---|---|---|---|---|---|---|
| Standard | 3,078.72 | 3,119.13 | 3,179.18 | 3,219.59 | 3,279.64 | 3,320.05 | 3,380.10 |
| Camarilla | 3,211.60 | 3,220.81 | 3,230.02 | 3,239.23 | 3,248.44 | 3,257.65 | 3,266.86 |
| Woodie | 3,088.54 | 3,124.04 | 3,189.00 | 3,224.50 | 3,289.46 | 3,324.96 | 3,389.92 |
| Fibonacci | 3,119.13 | 3,157.51 | 3,181.21 | 3,219.59 | 3,257.97 | 3,281.67 | 3,320.05 |
| Pivot points | S3 | S2 | S1 | PP | R1 | R2 | R3 |
|---|---|---|---|---|---|---|---|
| Standard | 2,528.14 | 2,687.16 | 2,923.38 | 3,082.40 | 3,318.62 | 3,477.64 | 3,713.86 |
| Camarilla | 3,050.91 | 3,087.14 | 3,123.37 | 3,159.60 | 3,195.83 | 3,232.06 | 3,268.29 |
| Woodie | 2,566.74 | 2,706.46 | 2,961.98 | 3,101.70 | 3,357.22 | 3,496.94 | 3,752.46 |
| Fibonacci | 2,687.16 | 2,838.14 | 2,931.42 | 3,082.40 | 3,233.38 | 3,326.66 | 3,477.64 |
Numerical data
The following is the status of the technical indicators and moving averages at the time of publication of this technical analysis:
| RSI (14): | 52.93 | |
| MACD (12,26,9): | 0.9100 | |
| Directional Movement: | -11.34 | |
| AROON (14): | -28.57 | |
| DEMA (21): | 3,165.62 | |
| Parabolic SAR (0,02-0,02-0,2): | 3,157.08 | |
| Elder Ray (13): | 3.07 | |
| Super Trend (3,10): | 3,156.50 | |
| Zig ZAG (10): | 3,168.03 | |
| VORTEX (21): | 0.9500 | |
| Stochastique (14,3,5): | 84.08 | |
| TEMA (21): | 3,168.77 | |
| Williams %R (14): | -24.84 | |
| Chande Momentum Oscillator (20): | -3.58 | |
| Repulse (5,40,3): | -0.0400 | |
| ROCnROLL: | -1 | |
| TRIX (15,9): | 0.0000 | |
| Courbe Coppock: | 0.43 |
| MA7: | 3,190.85 | |
| MA20: | 3,137.16 | |
| MA50: | 2,974.98 | |
| MA100: | 2,716.67 | |
| MAexp7: | 3,167.25 | |
| MAexp20: | 3,165.36 | |
| MAexp50: | 3,168.21 | |
| MAexp100: | 3,176.54 | |
| Price / MA7: | -0.42% | |
| Price / MA20: | +1.29% | |
| Price / MA50: | +6.81% | |
| Price / MA100: | +16.96% | |
| Price / MAexp7: | +0.32% | |
| Price / MAexp20: | +0.38% | |
| Price / MAexp50: | +0.29% | |
| Price / MAexp100: | +0.03% |
News
The last news published on CHIPOTLE MEXICAN GRILL INC. at the time of the generation of this analysis was as follows:
-
 Chipotle keeping ‘a close eye’ on customer behavior after raising menu prices, wages
- REAL FOOD FOR REAL HEROES: CHIPOTLE SERVES UP MORE THAN $1 MILLION IN FREE BURRITOS TO THE HEALTHCARE COMMUNITY
- CHIPOTLE ANNOUNCES FIRST QUARTER 2024 RESULTS
- CHIPOTLE INTRODUCES ITS REAL INGREDIENTS TO KUWAIT
- CHIPOTLE'S HOCKEY JERSEY BOGO OFFER RETURNS IN THE U.S. AND CANADA FOR THE 2024 STANLEY CUP® PLAYOFFS
About author

Online


Add a comment
Comments
0 comments on the analysis CHIPOTLE MEXICAN GRILL INC. - 15 min.