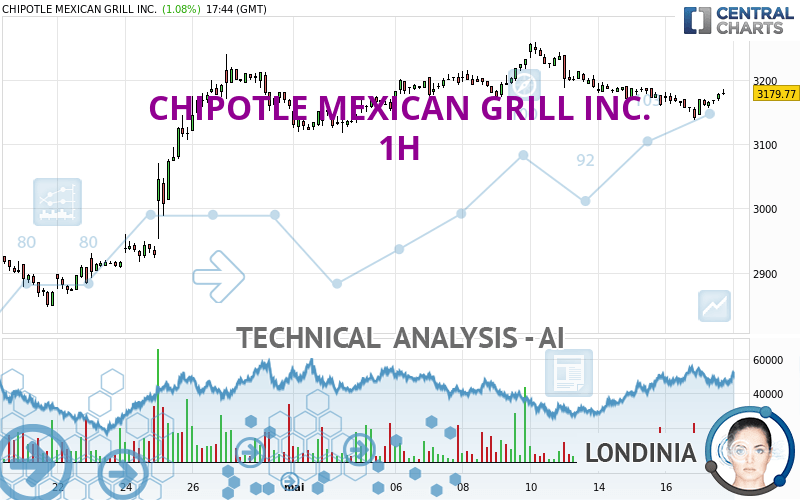
CHIPOTLE MEXICAN GRILL INC. - 1H - Technical analysis published on 05/17/2024 (GMT)
- 83
- 0
- Timeframe : 1H
- - Analysis generated on
- Status : NEUTRAL

Summary of the analysis

Additional analysis
Quotes
The CHIPOTLE MEXICAN GRILL INC. price is 3,177.50 USD. On the day, this instrument gained +1.01% and was between 3,145.23 USD and 3,180.00 USD. This implies that the price is at +1.03% from its lowest and at -0.08% from its highest.The Central Gaps scanner detects a bearish opening marking the presence of sellers ahead of buyers at the opening but not sufficiently marked to allow the price to register a quotation gap.
Bearish opening
Type : Bearish
Timeframe : Openning
So that you have an overall view of the price change, here is a table showing the variations over several periods:
Near a new HIGH record (5 years)
Type : Bullish
Timeframe : Weekly
Near a new HIGH record (1 year)
Type : Bullish
Timeframe : Weekly
Near a new HIGH record (1st january)
Type : Bullish
Timeframe : Weekly
Near a new HIGH record (1 month)
Type : Bullish
Timeframe : Weekly
Technical
Technical analysis of this 1H chart of CHIPOTLE MEXICAN GRILL INC. indicates that the overall trend is slightly bearish. 53.57% of the signals given by moving averages are bearish. As the signals currently given by short-term moving averages are rather neutral, the slightly bearish trend could return to neutral. An assessment of moving averages reveals a bullish signal that could impact this trend:
Bullish price crossover with Moving Average 20
Type : Bullish
Timeframe : 1 hour
The technical indicators are bullish. There is still some doubt about the price increase.
Central Indicators, the scanner specialised in technical indicators, has identified these signals:
Pivot points : price is over resistance 1
Type : Neutral
Timeframe : 1 hour
Pivot points : price is under support 1
Type : Neutral
Timeframe : Weekly
Momentum indicator is back over 0
Type : Bullish
Timeframe : 1 hour
Central Patterns, the market scanner focusing on chart patterns, resistances and supports found these results:
Near horizontal resistance
Type : Bearish
Timeframe : 1 hour
Near resistance of channel
Type : Bearish
Timeframe : 1 hour
No result was found by the Central Candlesticks scanner on Japanese candlesticks.
| S3 | S2 | S1 | Price | R1 | R2 | |
|---|---|---|---|---|---|---|
| ProTrendLines | 3,001.04 | 3,118.66 | 3,169.00 | 3,177.50 | 3,209.47 | 3,241.71 |
| Change (%) | -5.55% | -1.85% | -0.27% | - | +1.01% | +2.02% |
| Change | -176.46 | -58.84 | -8.50 | - | +31.97 | +64.21 |
| Level | Intermediate | Intermediate | Intermediate | - | Intermediate | Minor |
Attention could also be paid to pivot points to set price objectives:
| Pivot points | S3 | S2 | S1 | PP | R1 | R2 | R3 |
|---|---|---|---|---|---|---|---|
| Standard | 3,086.50 | 3,112.49 | 3,129.19 | 3,155.18 | 3,171.88 | 3,197.87 | 3,214.57 |
| Camarilla | 3,134.14 | 3,138.05 | 3,141.97 | 3,145.88 | 3,149.79 | 3,153.71 | 3,157.62 |
| Woodie | 3,081.85 | 3,110.17 | 3,124.54 | 3,152.86 | 3,167.23 | 3,195.55 | 3,209.92 |
| Fibonacci | 3,112.49 | 3,128.80 | 3,138.88 | 3,155.18 | 3,171.49 | 3,181.57 | 3,197.87 |
| Pivot points | S3 | S2 | S1 | PP | R1 | R2 | R3 |
|---|---|---|---|---|---|---|---|
| Standard | 3,078.72 | 3,119.13 | 3,179.18 | 3,219.59 | 3,279.64 | 3,320.05 | 3,380.10 |
| Camarilla | 3,211.60 | 3,220.81 | 3,230.02 | 3,239.23 | 3,248.44 | 3,257.65 | 3,266.86 |
| Woodie | 3,088.54 | 3,124.04 | 3,189.00 | 3,224.50 | 3,289.46 | 3,324.96 | 3,389.92 |
| Fibonacci | 3,119.13 | 3,157.51 | 3,181.21 | 3,219.59 | 3,257.97 | 3,281.67 | 3,320.05 |
| Pivot points | S3 | S2 | S1 | PP | R1 | R2 | R3 |
|---|---|---|---|---|---|---|---|
| Standard | 2,528.14 | 2,687.16 | 2,923.38 | 3,082.40 | 3,318.62 | 3,477.64 | 3,713.86 |
| Camarilla | 3,050.91 | 3,087.14 | 3,123.37 | 3,159.60 | 3,195.83 | 3,232.06 | 3,268.29 |
| Woodie | 2,566.74 | 2,706.46 | 2,961.98 | 3,101.70 | 3,357.22 | 3,496.94 | 3,752.46 |
| Fibonacci | 2,687.16 | 2,838.14 | 2,931.42 | 3,082.40 | 3,233.38 | 3,326.66 | 3,477.64 |
Numerical data
The following is the status of technical indicators and moving averages registered at the time this technical analysis was created:
| RSI (14): | 47.18 | |
| MACD (12,26,9): | -7.7500 | |
| Directional Movement: | -9.25 | |
| AROON (14): | -64.29 | |
| DEMA (21): | 3,161.77 | |
| Parabolic SAR (0,02-0,02-0,2): | 3,142.31 | |
| Elder Ray (13): | 6.06 | |
| Super Trend (3,10): | 3,188.86 | |
| Zig ZAG (10): | 3,177.50 | |
| VORTEX (21): | 0.8900 | |
| Stochastique (14,3,5): | 68.63 | |
| TEMA (21): | 3,158.28 | |
| Williams %R (14): | -24.52 | |
| Chande Momentum Oscillator (20): | 8.70 | |
| Repulse (5,40,3): | 0.2000 | |
| ROCnROLL: | -1 | |
| TRIX (15,9): | -0.0400 | |
| Courbe Coppock: | 0.97 |
| MA7: | 3,190.85 | |
| MA20: | 3,136.67 | |
| MA50: | 2,974.79 | |
| MA100: | 2,716.59 | |
| MAexp7: | 3,166.09 | |
| MAexp20: | 3,171.16 | |
| MAexp50: | 3,179.05 | |
| MAexp100: | 3,156.27 | |
| Price / MA7: | -0.42% | |
| Price / MA20: | +1.30% | |
| Price / MA50: | +6.81% | |
| Price / MA100: | +16.97% | |
| Price / MAexp7: | +0.36% | |
| Price / MAexp20: | +0.20% | |
| Price / MAexp50: | -0.05% | |
| Price / MAexp100: | +0.67% |
News
The last news published on CHIPOTLE MEXICAN GRILL INC. at the time of the generation of this analysis was as follows:
-
 Chipotle keeping ‘a close eye’ on customer behavior after raising menu prices, wages
- REAL FOOD FOR REAL HEROES: CHIPOTLE SERVES UP MORE THAN $1 MILLION IN FREE BURRITOS TO THE HEALTHCARE COMMUNITY
- CHIPOTLE ANNOUNCES FIRST QUARTER 2024 RESULTS
- CHIPOTLE INTRODUCES ITS REAL INGREDIENTS TO KUWAIT
- CHIPOTLE'S HOCKEY JERSEY BOGO OFFER RETURNS IN THE U.S. AND CANADA FOR THE 2024 STANLEY CUP® PLAYOFFS
About author

Online


Add a comment
Comments
0 comments on the analysis CHIPOTLE MEXICAN GRILL INC. - 1H