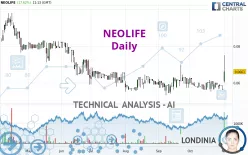
NEOLIFE - Daily - Technical analysis published on 11/01/2024 (GMT)
- 155
- 0
Click here for a new analysis!
- Timeframe : Daily
- - Analysis generated on
- Status : INVALID

Summary of the analysis

Additional analysis
Quotes
NEOLIFE rating 0.0661 EUR. The price has increased by +17.62% since the last closing and was between 0.0602 EUR and 0.0750 EUR. This implies that the price is at +9.80% from its lowest and at -11.87% from its highest.The Central Gaps scanner detects a bullish gap which is a sign that buyers have taken the lead in the very short term.
Opening Gap UP
Type : Bullish
Timeframe : Openning
A study of price movements over other periods shows the following variations:
New HIGH record (1 month)
Type : Bullish
Timeframe : Weekly
Technical
Technical analysis of this Daily chart of NEOLIFE indicates that the overall trend is slightly bullish. 60.71% of the signals given by moving averages are bullish. The overall trend could accelerate as strong bullish signals from short-term moving averages are expected. The Central Indicators scanner detects bullish signals on moving averages that could impact this trend:
Bullish price crossover with Moving Average 20
Type : Bullish
Timeframe : Daily
Bullish price crossover with Moving Average 50
Type : Bullish
Timeframe : Daily
Bullish price crossover with Moving Average 100
Type : Bullish
Timeframe : Daily
Bullish price crossover with adaptative moving average 20
Type : Bullish
Timeframe : Daily
Bullish price crossover with adaptative moving average 50
Type : Bullish
Timeframe : Daily
Bullish price crossover with adaptative moving average 100
Type : Bullish
Timeframe : Daily
In fact, 14 technical indicators on 18 studied are currently bullish. But beware of excesses. The Central Indicators scanner currently detects this:
CCI indicator is overbought : over 100
Type : Neutral
Timeframe : Daily
MACD indicator: bullish divergence
Type : Bullish
Timeframe : Daily
Pivot points : price is over resistance 2
Type : Neutral
Timeframe : Weekly
Pivot points : price is over resistance 3
Type : Neutral
Timeframe : Daily
RSI indicator is back over 50
Type : Bullish
Timeframe : Daily
MACD crosses UP its Moving Average
Type : Bullish
Timeframe : Daily
Parabolic SAR indicator bullish reversal
Type : Bullish
Timeframe : Daily
Aroon indicator bullish trend
Type : Bullish
Timeframe : Daily
Ichimoku : price is over the cloud
Type : Bullish
Timeframe : Daily
SuperTrend indicator bullish reversal
Type : Bullish
Timeframe : Daily
MACD indicator is back over 0
Type : Bullish
Timeframe : Daily
Ichimoku - Bullish crossover : Tenkan & Kijun
Type : Bullish
Timeframe : Daily
Williams %R indicator is back over -50
Type : Bullish
Timeframe : Daily
Central Patterns, the market scanner focusing on chart patterns, resistances and supports found these results:
Horizontal resistance is broken
Type : Bullish
Timeframe : Daily
Resistance of channel is broken
Type : Bullish
Timeframe : Daily
Resistance of triangle is broken
Type : Bullish
Timeframe : Daily
The presence of a bullish Japanese candlestick pattern detected by Central Candlesticks that could cause a very short term rebound was also detected:
Long white line
Type : Bullish
Timeframe : Daily
| S2 | S1 | Price | R1 | R2 | R3 | |
|---|---|---|---|---|---|---|
| ProTrendLines | 0.0216 | 0.0578 | 0.0661 | 0.0734 | 0.0828 | 0.0972 |
| Change (%) | -67.32% | -12.56% | - | +11.04% | +25.26% | +47.05% |
| Change | -0.0445 | -0.0083 | - | +0.0073 | +0.0167 | +0.0311 |
| Level | Major | Intermediate | - | Minor | Minor | Major |
Pivot points can also be used to set your price objectives. Here is the price situation in relation to pivot points:
| Pivot points | S3 | S2 | S1 | PP | R1 | R2 | R3 |
|---|---|---|---|---|---|---|---|
| Standard | 0.0530 | 0.0546 | 0.0554 | 0.0570 | 0.0578 | 0.0594 | 0.0602 |
| Camarilla | 0.0555 | 0.0558 | 0.0560 | 0.0562 | 0.0564 | 0.0566 | 0.0569 |
| Woodie | 0.0526 | 0.0544 | 0.0550 | 0.0568 | 0.0574 | 0.0592 | 0.0598 |
| Fibonacci | 0.0546 | 0.0555 | 0.0561 | 0.0570 | 0.0579 | 0.0585 | 0.0594 |
| Pivot points | S3 | S2 | S1 | PP | R1 | R2 | R3 |
|---|---|---|---|---|---|---|---|
| Standard | 0.0501 | 0.0527 | 0.0558 | 0.0584 | 0.0615 | 0.0641 | 0.0672 |
| Camarilla | 0.0574 | 0.0580 | 0.0585 | 0.0590 | 0.0595 | 0.0601 | 0.0606 |
| Woodie | 0.0505 | 0.0528 | 0.0562 | 0.0585 | 0.0619 | 0.0642 | 0.0676 |
| Fibonacci | 0.0527 | 0.0548 | 0.0562 | 0.0584 | 0.0605 | 0.0619 | 0.0641 |
| Pivot points | S3 | S2 | S1 | PP | R1 | R2 | R3 |
|---|---|---|---|---|---|---|---|
| Standard | 0.0457 | 0.0505 | 0.0533 | 0.0581 | 0.0609 | 0.0657 | 0.0685 |
| Camarilla | 0.0541 | 0.0548 | 0.0555 | 0.0562 | 0.0569 | 0.0576 | 0.0583 |
| Woodie | 0.0448 | 0.0500 | 0.0524 | 0.0576 | 0.0600 | 0.0652 | 0.0676 |
| Fibonacci | 0.0505 | 0.0534 | 0.0552 | 0.0581 | 0.0610 | 0.0628 | 0.0657 |
Numerical data
The following are the details of the technical indicators and moving averages that were collected to generate this technical analysis:
| RSI (14): | 63.53 | |
| MACD (12,26,9): | 0.0001 | |
| Directional Movement: | 20.6872 | |
| AROON (14): | 64.2857 | |
| DEMA (21): | 0.0597 | |
| Parabolic SAR (0,02-0,02-0,2): | 0.0552 | |
| Elder Ray (13): | 0.0078 | |
| Super Trend (3,10): | 0.0547 | |
| Zig ZAG (10): | 0.0661 | |
| VORTEX (21): | 0.9328 | |
| Stochastique (14,3,5): | 42.16 | |
| TEMA (21): | 0.0601 | |
| Williams %R (14): | -44.95 | |
| Chande Momentum Oscillator (20): | 0.0061 | |
| Repulse (5,40,3): | 2.4827 | |
| ROCnROLL: | 1 | |
| TRIX (15,9): | -0.0641 | |
| Courbe Coppock: | 4.85 |
| MA7: | 0.0596 | |
| MA20: | 0.0591 | |
| MA50: | 0.0599 | |
| MA100: | 0.0615 | |
| MAexp7: | 0.0603 | |
| MAexp20: | 0.0597 | |
| MAexp50: | 0.0604 | |
| MAexp100: | 0.0631 | |
| Price / MA7: | +10.91% | |
| Price / MA20: | +11.84% | |
| Price / MA50: | +10.35% | |
| Price / MA100: | +7.48% | |
| Price / MAexp7: | +9.62% | |
| Price / MAexp20: | +10.72% | |
| Price / MAexp50: | +9.44% | |
| Price / MAexp100: | +4.75% |
News
The last news published on NEOLIFE at the time of the generation of this analysis was as follows:
- NEOLIFE annonce son chiffre d'affaires et sa marge du 3ème trimestre 2023
- NEOLIFE annonce son résultat semestriel 2023
- Poursuite de la forte croissance au premier semestre 2023
- Bilan semestriel au 30/06/2023 du contrat de liquidité NEOLIFE
- Mise en œuvre d’une réduction de capital par réduction de la valeur nominale des actions
About author
Online


Add a comment
Comments
0 comments on the analysis NEOLIFE - Daily