NEOLIFE - Daily - Technical analysis published on 04/17/2023 (GMT)
- 341
- 0
Click here for a new analysis!
- Timeframe : Daily
- - Analysis generated on
- Status : TARGET REACHED

Summary of the analysis

Additional analysis
Quotes
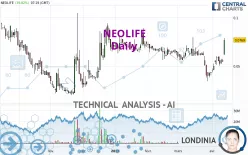
The NEOLIFE price is 0.0769 EUR. The price has increased by +39.82% since the last closing with the lowest point at 0.0620 EUR and the highest point at 0.0790 EUR. The deviation from the price is +24.03% for the low point and -2.66% for the high point.The Central Gaps scanner detects a bullish gap which is a sign that buyers have taken the lead in the very short term.
Opening Gap UP
Type : Bullish
Timeframe : Openning
A study of price movements over other periods shows the following variations:
Technical
A technical analysis in Daily of this NEOLIFE chart shows a bullish trend. 71.43% of the signals given by moving averages are bullish. This bullish trend is supported by the strong bullish signals given by short-term moving averages. The Central Indicators scanner detects bullish signals on moving averages that could impact this trend:
Bullish price crossover with Moving Average 50
Type : Bullish
Timeframe : Daily
Bullish price crossover with Moving Average 100
Type : Bullish
Timeframe : Daily
Bullish price crossover with adaptative moving average 20
Type : Bullish
Timeframe : Daily
Bullish price crossover with adaptative moving average 50
Type : Bullish
Timeframe : Daily
In fact, 13 technical indicators on 18 studied are currently positioned bullish. Caution: the Central Indicators scanner currently detects an excess:
CCI indicator is overbought : over 100
Type : Neutral
Timeframe : Daily
Williams %R indicator is overbought : over -20
Type : Neutral
Timeframe : Daily
Pivot points : price is over resistance 3
Type : Neutral
Timeframe : Daily
Pivot points : price is over resistance 3
Type : Neutral
Timeframe : Weekly
RSI indicator is back over 50
Type : Bullish
Timeframe : Daily
Parabolic SAR indicator bullish reversal
Type : Bullish
Timeframe : Daily
Aroon indicator bullish trend
Type : Bullish
Timeframe : Daily
Ichimoku : price is over the cloud
Type : Bullish
Timeframe : Daily
SuperTrend indicator bullish reversal
Type : Bullish
Timeframe : Daily
An analysis of the price chart with the Central Patterns scanner (detector of chart patterns and resistances and supports) shows a result that can have an impact on the price change:
Near resistance of triangle
Type : Bearish
Timeframe : Daily
The Central Candlesticks scanner which studies Japanese candlesticks did not detect anything.
| S3 | S2 | S1 | Price | R1 | R2 | R3 | |
|---|---|---|---|---|---|---|---|
| ProTrendLines | 0.0401 | 0.0533 | 0.0685 | 0.0769 | 0.0919 | 0.1178 | 0.1310 |
| Change (%) | -47.85% | -30.69% | -10.92% | - | +19.51% | +53.19% | +70.35% |
| Change | -0.0368 | -0.0236 | -0.0084 | - | +0.0150 | +0.0409 | +0.0541 |
| Level | Major | Major | Major | - | Intermediate | Minor | Minor |
To determine price objectives, it is also possible to use the pivot points. Here is the price position in relation to pivot points:
| Pivot points | S3 | S2 | S1 | PP | R1 | R2 | R3 |
|---|---|---|---|---|---|---|---|
| Standard | 0.0507 | 0.0525 | 0.0538 | 0.0556 | 0.0569 | 0.0587 | 0.0600 |
| Camarilla | 0.0542 | 0.0544 | 0.0547 | 0.0550 | 0.0553 | 0.0556 | 0.0559 |
| Woodie | 0.0504 | 0.0524 | 0.0535 | 0.0555 | 0.0566 | 0.0586 | 0.0597 |
| Fibonacci | 0.0525 | 0.0537 | 0.0545 | 0.0556 | 0.0568 | 0.0576 | 0.0587 |
| Pivot points | S3 | S2 | S1 | PP | R1 | R2 | R3 |
|---|---|---|---|---|---|---|---|
| Standard | 0.0397 | 0.0451 | 0.0500 | 0.0554 | 0.0603 | 0.0657 | 0.0706 |
| Camarilla | 0.0522 | 0.0531 | 0.0541 | 0.0550 | 0.0559 | 0.0569 | 0.0578 |
| Woodie | 0.0396 | 0.0450 | 0.0499 | 0.0553 | 0.0602 | 0.0656 | 0.0705 |
| Fibonacci | 0.0451 | 0.0490 | 0.0514 | 0.0554 | 0.0593 | 0.0617 | 0.0657 |
| Pivot points | S3 | S2 | S1 | PP | R1 | R2 | R3 |
|---|---|---|---|---|---|---|---|
| Standard | -0.0203 | 0.0071 | 0.0253 | 0.0527 | 0.0709 | 0.0983 | 0.1165 |
| Camarilla | 0.0311 | 0.0352 | 0.0394 | 0.0436 | 0.0478 | 0.0520 | 0.0561 |
| Woodie | -0.0248 | 0.0048 | 0.0208 | 0.0504 | 0.0664 | 0.0960 | 0.1120 |
| Fibonacci | 0.0071 | 0.0245 | 0.0353 | 0.0527 | 0.0701 | 0.0809 | 0.0983 |
Numerical data
The following is the status of technical indicators and moving averages registered at the time this technical analysis was created:
| RSI (14): | 66.66 | |
| MACD (12,26,9): | 0.0000 | |
| Directional Movement: | 21.0885 | |
| AROON (14): | 78.5714 | |
| DEMA (21): | 0.0557 | |
| Parabolic SAR (0,02-0,02-0,2): | 0.0344 | |
| Elder Ray (13): | 0.0134 | |
| Super Trend (3,10): | 0.0460 | |
| Zig ZAG (10): | 0.0771 | |
| VORTEX (21): | 0.9436 | |
| Stochastique (14,3,5): | 79.14 | |
| TEMA (21): | 0.0579 | |
| Williams %R (14): | -8.74 | |
| Chande Momentum Oscillator (20): | 0.0346 | |
| Repulse (5,40,3): | 23.5140 | |
| ROCnROLL: | 1 | |
| TRIX (15,9): | -0.6656 | |
| Courbe Coppock: | 10.79 |
| MA7: | 0.0586 | |
| MA20: | 0.0551 | |
| MA50: | 0.0607 | |
| MA100: | 0.0612 | |
| MAexp7: | 0.0600 | |
| MAexp20: | 0.0569 | |
| MAexp50: | 0.0593 | |
| MAexp100: | 0.0630 | |
| Price / MA7: | +31.23% | |
| Price / MA20: | +39.56% | |
| Price / MA50: | +26.69% | |
| Price / MA100: | +25.65% | |
| Price / MAexp7: | +28.17% | |
| Price / MAexp20: | +35.15% | |
| Price / MAexp50: | +29.68% | |
| Price / MAexp100: | +22.06% |
News
Don't forget to follow the news on NEOLIFE. At the time of publication of this analysis, the latest news was as follows:
- NEOLIFE - Forte croissance au premier trimestre 2023
- NEOLIFE annonce son résultat annuel 2022
- NEOLIFE dépasse les 13 M€ de CA en 2022
- Bilan semestriel au 31/12/2022 du contrat de liquidité NEOLIFE
- Calendrier de communication financière 2023
About author
Online


Add a comment
Comments
0 comments on the analysis NEOLIFE - Daily