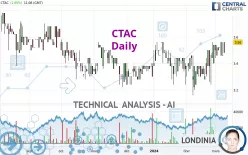
CTAC - Daily - Technical analysis published on 03/11/2024 (GMT)
- 138
- 0
Click here for a new analysis!
- Timeframe : Daily
- - Analysis generated on
- Status : INVALID

Summary of the analysis

Additional analysis
Quotes
CTAC rating 3.56 EUR. On the day, this instrument gained +2.89% and was traded between 3.48 EUR and 3.56 EUR over the period. The price is currently at +2.30% from its lowest and 0% from its highest.The Central Gaps scanner detects a bullish opening. A small advantage for buyers in the very short term.
Bullish opening
Type : Bullish
Timeframe : Openning
Here is a more detailed summary of the historical variations registered by CTAC:
Near a new HIGH record (1st january)
Type : Bullish
Timeframe : Weekly
Near a new HIGH record (1 month)
Type : Bullish
Timeframe : Weekly
Technical
A technical analysis in Daily of this CTAC chart shows a strongly bullish trend. The signals given by moving averages are 82.14% bullish. This strongly bullish trend seems to be running out of steam given the signals being given by short-term moving averages. An assessment of moving averages reveals several bullish signals that could impact this trend:
Bullish price crossover with adaptative moving average 50
Type : Bullish
Timeframe : Daily
Bullish price crossover with adaptative moving average 100
Type : Bullish
Timeframe : Daily
An assessment of technical indicators shows a moderate bullish signal.
Caution: the Central Indicators scanner currently detects an excess:
Williams %R indicator is overbought : over -20
Type : Neutral
Timeframe : Daily
Pivot points : price is over resistance 1
Type : Neutral
Timeframe : Daily
Price is back over the pivot point
Type : Bullish
Timeframe : Weekly
No signals are given by Central Patterns, a market scanner specialised in chart patterns, resistances and supports.
No result was found by the Central Candlesticks scanner on Japanese candlesticks.
| S3 | S2 | S1 | Price | R1 | R2 | R3 | |
|---|---|---|---|---|---|---|---|
| ProTrendLines | 3.44 | 3.50 | 3.55 | 3.56 | 3.68 | 3.80 | 3.90 |
| Change (%) | -3.37% | -1.69% | -0.28% | - | +3.37% | +6.74% | +9.55% |
| Change | -0.12 | -0.06 | -0.01 | - | +0.12 | +0.24 | +0.34 |
| Level | Major | Major | Intermediate | - | Intermediate | Major | Minor |
Attention could also be paid to pivot points to set price objectives:
| Pivot points | S3 | S2 | S1 | PP | R1 | R2 | R3 |
|---|---|---|---|---|---|---|---|
| Standard | 3.33 | 3.39 | 3.43 | 3.49 | 3.53 | 3.59 | 3.63 |
| Camarilla | 3.43 | 3.44 | 3.45 | 3.46 | 3.47 | 3.48 | 3.49 |
| Woodie | 3.31 | 3.39 | 3.41 | 3.49 | 3.51 | 3.59 | 3.61 |
| Fibonacci | 3.39 | 3.43 | 3.46 | 3.49 | 3.53 | 3.56 | 3.59 |
| Pivot points | S3 | S2 | S1 | PP | R1 | R2 | R3 |
|---|---|---|---|---|---|---|---|
| Standard | 2.88 | 3.02 | 3.28 | 3.42 | 3.68 | 3.82 | 4.08 |
| Camarilla | 3.43 | 3.47 | 3.50 | 3.54 | 3.58 | 3.61 | 3.65 |
| Woodie | 2.94 | 3.05 | 3.34 | 3.45 | 3.74 | 3.85 | 4.14 |
| Fibonacci | 3.02 | 3.17 | 3.27 | 3.42 | 3.57 | 3.67 | 3.82 |
Numerical data
The following are the details of the technical indicators and moving averages that were collected to generate this technical analysis:
| RSI (14): | 54.11 | |
| MACD (12,26,9): | 0.0300 | |
| Directional Movement: | -7.62 | |
| AROON (14): | 7.15 | |
| DEMA (21): | 3.50 | |
| Parabolic SAR (0,02-0,02-0,2): | 3.34 | |
| Elder Ray (13): | 0.01 | |
| Super Trend (3,10): | 3.61 | |
| Zig ZAG (10): | 3.50 | |
| VORTEX (21): | 1.0600 | |
| Stochastique (14,3,5): | 83.33 | |
| TEMA (21): | 3.52 | |
| Williams %R (14): | -18.75 | |
| Chande Momentum Oscillator (20): | 0.18 | |
| Repulse (5,40,3): | 1.5700 | |
| ROCnROLL: | 1 | |
| TRIX (15,9): | 0.1000 | |
| Courbe Coppock: | 9.08 |
| MA7: | 3.51 | |
| MA20: | 3.43 | |
| MA50: | 3.43 | |
| MA100: | 3.41 | |
| MAexp7: | 3.50 | |
| MAexp20: | 3.46 | |
| MAexp50: | 3.43 | |
| MAexp100: | 3.45 | |
| Price / MA7: | +1.42% | |
| Price / MA20: | +3.79% | |
| Price / MA50: | +3.79% | |
| Price / MA100: | +4.40% | |
| Price / MAexp7: | +1.71% | |
| Price / MAexp20: | +2.89% | |
| Price / MAexp50: | +3.79% | |
| Price / MAexp100: | +3.19% |
News
The last news published on CTAC at the time of the generation of this analysis was as follows:
- IoT Leader KORE Announces Effectiveness of S-4 Registration Statement For Proposed Combination With Cerberus-backed CTAC
- SHAREHOLDER INVESTIGATION: Halper Sadeh LLP Investigates the Following Companies - SCPE, SPNV, FTCV, CTAC, ITAC
- SHAREHOLDER ALERT: Monteverde & Associates PC Announces an Investigation of Cerberus Telecom Acquisition Corp. - CTAC
-
 Ctac
Ctac
About author
Online


Add a comment
Comments
0 comments on the analysis CTAC - Daily