CTAC overview
CTAC
> Analyses

 Thank you
Reply
Chart
Thank you
Reply
Chart
Londinia
has published a new analysis.
- 0
- 98612
- 16057
- 0
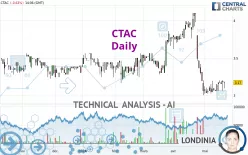
Timeframe : Daily - Simple chart
Status : TARGET REACHED
CTAC is part of a very strong bearish trend. Traders may consider trading only short positions (for sale) as long as the price remains well below 3.44 EUR. The next support located at 3.07 EUR is the…
CTAC
> Analyses
 Thank you
Reply
Chart
Thank you
Reply
Chart
Londinia
has published a new analysis.
- 0
- 98612
- 16057
- 0
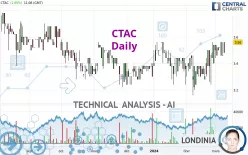
Timeframe : Daily - Simple chart
Status : INVALID
The basic bullish trend is very strong on CTAC but the short term shows some signs of running out of steam. However, a purchase could be considered as long as the price remains above 3.50 EUR.…
CTAC
> Analyses
 Thank you
Reply
Chart
Thank you
Reply
Chart
Londinia
has published a new analysis.
- 0
- 98612
- 16057
- 0
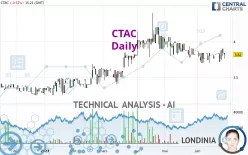
Timeframe : Daily - Simple chart
Status : NEUTRAL
The neutral short-term trend shows a weakening of the basic, slightly bullish trend on CTAC. It is difficult to advise a trading direction under these conditions. The first resistance is located at…
CTAC
> Analyses
 Thank you
Reply
Chart
Thank you
Reply
Chart
Londinia
has published a new analysis.
- 0
- 98612
- 16057
- 0
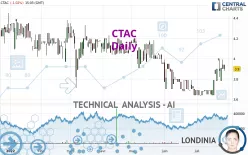
Timeframe : Daily - Simple chart
Status : TARGET REACHED
The current short-term bullish acceleration on CTAC should quickly allow the basic trend to return to bullish. To avoid contradicting the short term, traders may prefer long positions (at the time of…


