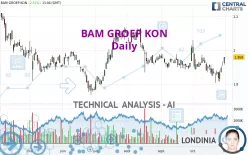
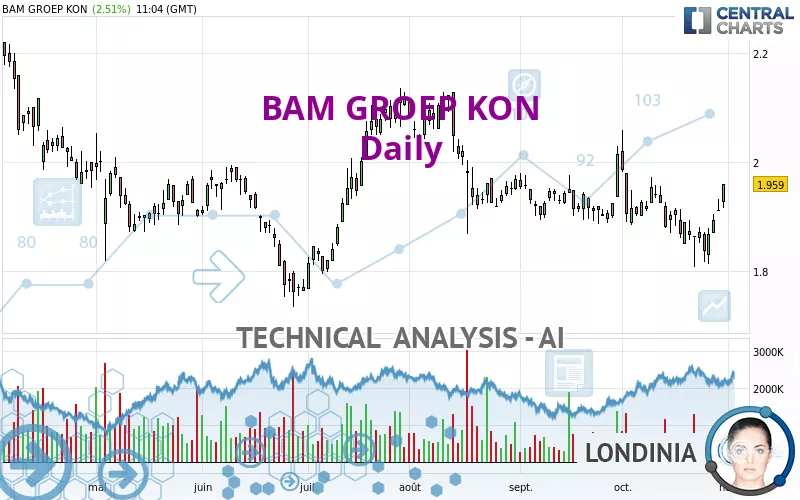
BAM GROEP KON - Daily - Technical analysis published on 10/31/2023 (GMT)
- 169
- 0
Click here for a new analysis!
- Timeframe : Daily
- - Analysis generated on
- Status : TARGET REACHED
Summary of the analysis

Additional analysis
Quotes
BAM GROEP KON rating 1.959 EUR. The price has increased by +2.51% since the last closing and was traded between 1.916 EUR and 1.959 EUR over the period. The price is currently at +2.24% from its lowest and 0% from its highest.So that you have an overall view of the price change, here is a table showing the variations over several periods:
Technical
Technical analysis of BAM GROEP KON in Daily shows an overall slightly bullish trend. 60.71% of the signals given by moving averages are bullish. The overall trend could accelerate as strong bullish signals from short-term moving averages are expected. The Central Indicators scanner detects bullish signals on moving averages that could impact this trend:
Bullish trend reversal : adaptative moving average 20
Type : Bullish
Timeframe : Daily
Bullish price crossover with Moving Average 50
Type : Bullish
Timeframe : Daily
Bullish price crossover with Moving Average 100
Type : Bullish
Timeframe : Daily
Bullish price crossover with adaptative moving average 20
Type : Bullish
Timeframe : Daily
Bullish price crossover with adaptative moving average 50
Type : Bullish
Timeframe : Daily
Bullish price crossover with adaptative moving average 100
Type : Bullish
Timeframe : Daily
The probability of a further increase is high given the direction of the technical indicators.
Caution: the Central Indicators scanner currently detects an excess:
CCI indicator is overbought : over 100
Type : Neutral
Timeframe : Daily
Williams %R indicator is overbought : over -20
Type : Neutral
Timeframe : Daily
Pivot points : price is over resistance 1
Type : Neutral
Timeframe : Weekly
Pivot points : price is over resistance 3
Type : Neutral
Timeframe : Daily
Momentum indicator is back over 0
Type : Bullish
Timeframe : Daily
Central Patterns, the market scanner focusing on chart patterns, resistances and supports found these results:
Near horizontal resistance
Type : Bearish
Timeframe : Daily
Resistance of channel is broken
Type : Bullish
Timeframe : Daily
Resistance of triangle is broken
Type : Bullish
Timeframe : Daily
No result was found by the Central Candlesticks scanner on Japanese candlesticks.
| S3 | S2 | S1 | Price | R1 | R2 | R3 | |
|---|---|---|---|---|---|---|---|
| ProTrendLines | 1.762 | 1.830 | 1.901 | 1.959 | 2.014 | 2.120 | 2.235 |
| Change (%) | -10.06% | -6.58% | -2.96% | - | +2.81% | +8.22% | +14.09% |
| Change | -0.197 | -0.129 | -0.058 | - | +0.055 | +0.161 | +0.276 |
| Level | Minor | Major | Major | - | Major | Major | Minor |
Attention could also be paid to pivot points to set price objectives:
| Pivot points | S3 | S2 | S1 | PP | R1 | R2 | R3 |
|---|---|---|---|---|---|---|---|
| Standard | 1.881 | 1.896 | 1.903 | 1.918 | 1.925 | 1.940 | 1.947 |
| Camarilla | 1.905 | 1.907 | 1.909 | 1.911 | 1.913 | 1.915 | 1.917 |
| Woodie | 1.878 | 1.894 | 1.900 | 1.916 | 1.922 | 1.938 | 1.944 |
| Fibonacci | 1.896 | 1.904 | 1.909 | 1.918 | 1.926 | 1.931 | 1.940 |
| Pivot points | S3 | S2 | S1 | PP | R1 | R2 | R3 |
|---|---|---|---|---|---|---|---|
| Standard | 1.736 | 1.771 | 1.833 | 1.868 | 1.930 | 1.965 | 2.027 |
| Camarilla | 1.867 | 1.876 | 1.885 | 1.894 | 1.903 | 1.912 | 1.921 |
| Woodie | 1.749 | 1.778 | 1.846 | 1.875 | 1.943 | 1.972 | 2.040 |
| Fibonacci | 1.771 | 1.808 | 1.831 | 1.868 | 1.905 | 1.928 | 1.965 |
| Pivot points | S3 | S2 | S1 | PP | R1 | R2 | R3 |
|---|---|---|---|---|---|---|---|
| Standard | 1.781 | 1.834 | 1.924 | 1.977 | 2.067 | 2.120 | 2.210 |
| Camarilla | 1.975 | 1.988 | 2.001 | 2.014 | 2.027 | 2.040 | 2.053 |
| Woodie | 1.800 | 1.843 | 1.943 | 1.986 | 2.086 | 2.129 | 2.229 |
| Fibonacci | 1.834 | 1.889 | 1.922 | 1.977 | 2.032 | 2.065 | 2.120 |
Numerical data
The following is the status of technical indicators and moving averages registered at the time this technical analysis was created:
| RSI (14): | 57.35 | |
| MACD (12,26,9): | -0.0080 | |
| Directional Movement: | 2.472 | |
| AROON (14): | -57.143 | |
| DEMA (21): | 1.888 | |
| Parabolic SAR (0,02-0,02-0,2): | 1.814 | |
| Elder Ray (13): | 0.038 | |
| Super Trend (3,10): | 1.966 | |
| Zig ZAG (10): | 1.956 | |
| VORTEX (21): | 0.8830 | |
| Stochastique (14,3,5): | 73.76 | |
| TEMA (21): | 1.892 | |
| Williams %R (14): | 0.00 | |
| Chande Momentum Oscillator (20): | 0.075 | |
| Repulse (5,40,3): | 3.3750 | |
| ROCnROLL: | 1 | |
| TRIX (15,9): | -0.1100 | |
| Courbe Coppock: | 3.38 |
| MA7: | 1.886 | |
| MA20: | 1.900 | |
| MA50: | 1.921 | |
| MA100: | 1.941 | |
| MAexp7: | 1.903 | |
| MAexp20: | 1.902 | |
| MAexp50: | 1.923 | |
| MAexp100: | 1.944 | |
| Price / MA7: | +3.87% | |
| Price / MA20: | +3.11% | |
| Price / MA50: | +1.98% | |
| Price / MA100: | +0.93% | |
| Price / MAexp7: | +2.94% | |
| Price / MAexp20: | +3.00% | |
| Price / MAexp50: | +1.87% | |
| Price / MAexp100: | +0.77% |
News
The last news published on BAM GROEP KON at the time of the generation of this analysis was as follows:
-
 'Jackass' star Bam Margera surrenders in Pennsylvania
-
'Jackass' star Bam Margera sought by Pennsylvania police
- BAM Announces Kroll Bond Rating Agency Upgrades Fidus Re Series 2018-1 to AA-Plus
- P2 Gold BAM Intersects Additional Near-Surface Gold Mineralization; Geophysics Identifies Potential Feeder System and Porphyry
- P2 Gold Intersects 1.49 g/t Gold over 44.94 meters From Surface at BAM
About author
Online


Add a comment
Comments
0 comments on the analysis BAM GROEP KON - Daily