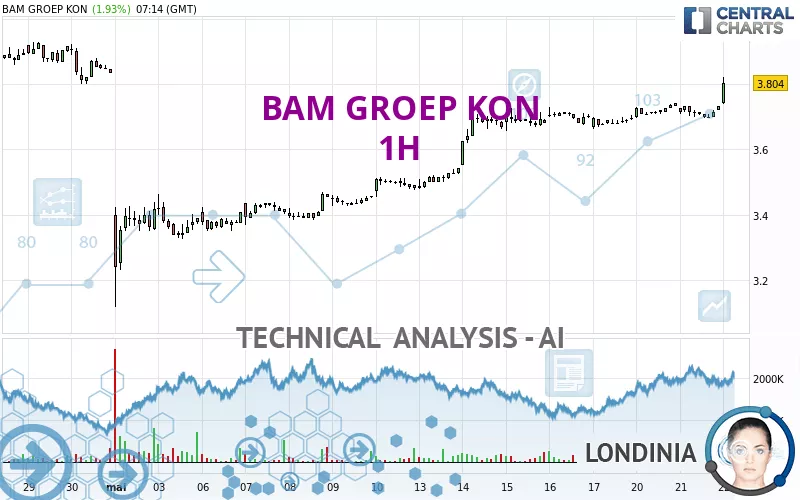
BAM GROEP KON - 1H - Technical analysis published on 05/22/2024 (GMT)
- 171
- 0
Click here for a new analysis!
- Timeframe : 1H
- - Analysis generated on
- Status : TARGET REACHED
Summary of the analysis

Additional analysis
Quotes
The BAM GROEP KON rating is 3.810 EUR. The price registered an increase of +2.09% on the session and was between 3.740 EUR and 3.822 EUR. This implies that the price is at +1.87% from its lowest and at -0.31% from its highest.The Central Gaps scanner detects the formation of a bullish gap marking the strong presence of buyers against sellers at the opening. This formed a quotation gap.
Opening Gap UP
Type : Bullish
Timeframe : Openning
Here is a more detailed summary of the historical variations registered by BAM GROEP KON:
Technical
Technical analysis of BAM GROEP KON in 1H shows a strongly overall bullish trend. 92.86% of the signals given by moving averages are bullish. The overall trend is supported by the strong bullish signals from short-term moving averages. The Central Indicators scanner does not detect any result on moving averages that would impact this trend.
The probability of a further increase is high given the direction of the technical indicators.
Caution: the Central Indicators scanner currently detects an excess:
CCI indicator is overbought : over 100
Type : Neutral
Timeframe : 1 hour
Williams %R indicator is overbought : over -20
Type : Neutral
Timeframe : 1 hour
Pivot points : price is over resistance 2
Type : Neutral
Timeframe : 1 hour
MACD crosses UP its Moving Average
Type : Bullish
Timeframe : 1 hour
Parabolic SAR indicator bullish reversal
Type : Bullish
Timeframe : 1 hour
Aroon indicator bullish trend
Type : Bullish
Timeframe : 1 hour
No signals are given by Central Patterns, a market scanner specialised in chart patterns, resistances and supports.
Central Candlesticks, the scanner specialised in Japanese candlesticks, detects a bullish signal that could support the hypothesis of a small rebound in the very short term:
Upside gap
Type : Bullish
Timeframe : 1 hour
| S3 | S2 | S1 | Price | R1 | R2 | R3 | |
|---|---|---|---|---|---|---|---|
| ProTrendLines | 3.390 | 3.467 | 3.785 | 3.810 | 3.929 | 4.020 | 4.542 |
| Change (%) | -11.02% | -9.00% | -0.66% | - | +3.12% | +5.51% | +19.21% |
| Change | -0.420 | -0.343 | -0.025 | - | +0.119 | +0.210 | +0.732 |
| Level | Major | Intermediate | Major | - | Minor | Major | Major |
To determine price objectives, it is also possible to use the pivot points. Here is the price position in relation to pivot points:
| Pivot points | S3 | S2 | S1 | PP | R1 | R2 | R3 |
|---|---|---|---|---|---|---|---|
| Standard | 3.672 | 3.684 | 3.708 | 3.720 | 3.744 | 3.756 | 3.780 |
| Camarilla | 3.722 | 3.725 | 3.729 | 3.732 | 3.735 | 3.739 | 3.742 |
| Woodie | 3.678 | 3.687 | 3.714 | 3.723 | 3.750 | 3.759 | 3.786 |
| Fibonacci | 3.684 | 3.698 | 3.706 | 3.720 | 3.734 | 3.742 | 3.756 |
| Pivot points | S3 | S2 | S1 | PP | R1 | R2 | R3 |
|---|---|---|---|---|---|---|---|
| Standard | 3.289 | 3.383 | 3.541 | 3.635 | 3.793 | 3.887 | 4.045 |
| Camarilla | 3.629 | 3.652 | 3.675 | 3.698 | 3.721 | 3.744 | 3.767 |
| Woodie | 3.320 | 3.399 | 3.572 | 3.651 | 3.824 | 3.903 | 4.076 |
| Fibonacci | 3.383 | 3.480 | 3.539 | 3.635 | 3.732 | 3.791 | 3.887 |
| Pivot points | S3 | S2 | S1 | PP | R1 | R2 | R3 |
|---|---|---|---|---|---|---|---|
| Standard | 2.626 | 2.953 | 3.393 | 3.720 | 4.160 | 4.487 | 4.927 |
| Camarilla | 3.623 | 3.693 | 3.764 | 3.834 | 3.904 | 3.975 | 4.045 |
| Woodie | 2.684 | 2.981 | 3.451 | 3.748 | 4.218 | 4.515 | 4.985 |
| Fibonacci | 2.953 | 3.246 | 3.427 | 3.720 | 4.013 | 4.194 | 4.487 |
Numerical data
The following is the status of technical indicators and moving averages registered at the time this technical analysis was created:
| RSI (14): | 73.06 | |
| MACD (12,26,9): | 0.0140 | |
| Directional Movement: | 30.207 | |
| AROON (14): | 28.571 | |
| DEMA (21): | 3.736 | |
| Parabolic SAR (0,02-0,02-0,2): | 3.696 | |
| Elder Ray (13): | 0.043 | |
| Super Trend (3,10): | 3.704 | |
| Zig ZAG (10): | 3.786 | |
| VORTEX (21): | 1.1040 | |
| Stochastique (14,3,5): | 70.58 | |
| TEMA (21): | 3.730 | |
| Williams %R (14): | -18.00 | |
| Chande Momentum Oscillator (20): | 0.050 | |
| Repulse (5,40,3): | 1.4120 | |
| ROCnROLL: | 1 | |
| TRIX (15,9): | 0.0370 | |
| Courbe Coppock: | 0.53 |
| MA7: | 3.716 | |
| MA20: | 3.657 | |
| MA50: | 3.570 | |
| MA100: | 3.103 | |
| MAexp7: | 3.733 | |
| MAexp20: | 3.720 | |
| MAexp50: | 3.686 | |
| MAexp100: | 3.651 | |
| Price / MA7: | +2.53% | |
| Price / MA20: | +4.18% | |
| Price / MA50: | +6.72% | |
| Price / MA100: | +22.78% | |
| Price / MAexp7: | +2.06% | |
| Price / MAexp20: | +2.42% | |
| Price / MAexp50: | +3.36% | |
| Price / MAexp100: | +4.35% |
News
The last news published on BAM GROEP KON at the time of the generation of this analysis was as follows:
-
 'Jackass' star Bam Margera surrenders in Pennsylvania
-
'Jackass' star Bam Margera sought by Pennsylvania police
- BAM Announces Kroll Bond Rating Agency Upgrades Fidus Re Series 2018-1 to AA-Plus
- P2 Gold BAM Intersects Additional Near-Surface Gold Mineralization; Geophysics Identifies Potential Feeder System and Porphyry
- P2 Gold Intersects 1.49 g/t Gold over 44.94 meters From Surface at BAM
About author
Online


Add a comment
Comments
0 comments on the analysis BAM GROEP KON - 1H