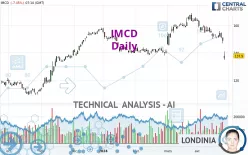
IMCD - Daily - Technical analysis published on 04/26/2024 (GMT)
- 134
- 0
Click here for a new analysis!
- Timeframe : Daily
- - Analysis generated on
- Status : LEVEL MAINTAINED

Summary of the analysis

Additional analysis
Quotes
The IMCD price is 138.10 EUR. On the day, this instrument lost -7.32% and was between 134.85 EUR and 140.95 EUR. This implies that the price is at +2.41% from its lowest and at -2.02% from its highest.The Central Gaps scanner detects the formation of a bearish gap marking the strong presence of sellers ahead of buyers at the opening. This formed a quotation gap.
Opening Gap DOWN
Type : Bearish
Timeframe : Openning
So that you have an overall view of the price change, here is a table showing the variations over several periods:
New LOW record (1 month)
Type : Bearish
Timeframe : Weekly
Technical
Technical analysis of IMCD in Daily shows an overall bearish trend. The signals given by moving averages are at 67.86% bearish. This bearish trend shows slight signs of slowing down given the slightly bearish signals of short-term moving averages. The Central Indicators scanner detects a bearish signal on moving averages that could impact this trend:
Moving Average bearish crossovers : AMA20 & AMA50
Type : Bearish
Timeframe : Daily
In fact, according to the parameters integrated into the Central Analyzer system, 13 technical indicators out of 18 analysed are currently bearish. Caution: the Central Indicators scanner currently detects an excess:
RSI indicator is oversold : under 30
Type : Neutral
Timeframe : Daily
CCI indicator is oversold : under -100
Type : Neutral
Timeframe : Daily
Williams %R indicator is oversold : under -80
Type : Neutral
Timeframe : Daily
Pivot points : price is under support 3
Type : Neutral
Timeframe : Daily
An analysis of the price chart with the Central Patterns scanner (detector of chart patterns and resistances and supports) shows several results that can have an impact on the price change:
Near horizontal support
Type : Bullish
Timeframe : Daily
Support of channel is broken
Type : Bearish
Timeframe : Daily
No result was found by the Central Candlesticks scanner on Japanese candlesticks.
| S3 | S2 | S1 | Price | R1 | R2 | R3 | |
|---|---|---|---|---|---|---|---|
| ProTrendLines | 112.44 | 121.86 | 126.38 | 138.10 | 138.78 | 153.61 | 167.60 |
| Change (%) | -18.58% | -11.76% | -8.49% | - | +0.49% | +11.23% | +21.36% |
| Change | -25.66 | -16.24 | -11.72 | - | +0.68 | +15.51 | +29.50 |
| Level | Major | Minor | Intermediate | - | Major | Major | Major |
To determine price objectives, it is also possible to use the pivot points. Here is the price position in relation to pivot points:
| Pivot points | S3 | S2 | S1 | PP | R1 | R2 | R3 |
|---|---|---|---|---|---|---|---|
| Standard | 142.72 | 144.83 | 146.92 | 149.03 | 151.12 | 153.23 | 155.32 |
| Camarilla | 147.85 | 148.23 | 148.62 | 149.00 | 149.39 | 149.77 | 150.16 |
| Woodie | 142.70 | 144.83 | 146.90 | 149.03 | 151.10 | 153.23 | 155.30 |
| Fibonacci | 144.83 | 146.44 | 147.43 | 149.03 | 150.64 | 151.63 | 153.23 |
| Pivot points | S3 | S2 | S1 | PP | R1 | R2 | R3 |
|---|---|---|---|---|---|---|---|
| Standard | 141.68 | 146.02 | 148.63 | 152.97 | 155.58 | 159.92 | 162.53 |
| Camarilla | 149.34 | 149.98 | 150.61 | 151.25 | 151.89 | 152.52 | 153.16 |
| Woodie | 140.83 | 145.59 | 147.78 | 152.54 | 154.73 | 159.49 | 161.68 |
| Fibonacci | 146.02 | 148.67 | 150.31 | 152.97 | 155.62 | 157.26 | 159.92 |
| Pivot points | S3 | S2 | S1 | PP | R1 | R2 | R3 |
|---|---|---|---|---|---|---|---|
| Standard | 126.17 | 135.88 | 149.62 | 159.33 | 173.07 | 182.78 | 196.52 |
| Camarilla | 156.90 | 159.05 | 161.20 | 163.35 | 165.50 | 167.65 | 169.80 |
| Woodie | 128.18 | 136.89 | 151.63 | 160.34 | 175.08 | 183.79 | 198.53 |
| Fibonacci | 135.88 | 144.84 | 150.38 | 159.33 | 168.29 | 173.83 | 182.78 |
Numerical data
The following are the details of the technical indicators and moving averages that were collected to generate this technical analysis:
| RSI (14): | 23.25 | |
| MACD (12,26,9): | -2.6800 | |
| Directional Movement: | -29.05 | |
| AROON (14): | -100.00 | |
| DEMA (21): | 150.67 | |
| Parabolic SAR (0,02-0,02-0,2): | 155.57 | |
| Elder Ray (13): | -14.30 | |
| Super Trend (3,10): | 151.10 | |
| Zig ZAG (10): | 140.00 | |
| VORTEX (21): | 0.6700 | |
| Stochastique (14,3,5): | 15.70 | |
| TEMA (21): | 147.05 | |
| Williams %R (14): | -81.89 | |
| Chande Momentum Oscillator (20): | -17.00 | |
| Repulse (5,40,3): | 1.4600 | |
| ROCnROLL: | 2 | |
| TRIX (15,9): | -0.0800 | |
| Courbe Coppock: | 12.37 |
| MA7: | 150.19 | |
| MA20: | 154.74 | |
| MA50: | 153.76 | |
| MA100: | 150.43 | |
| MAexp7: | 148.96 | |
| MAexp20: | 152.88 | |
| MAexp50: | 152.88 | |
| MAexp100: | 148.76 | |
| Price / MA7: | -8.05% | |
| Price / MA20: | -10.75% | |
| Price / MA50: | -10.18% | |
| Price / MA100: | -8.20% | |
| Price / MAexp7: | -7.29% | |
| Price / MAexp20: | -9.67% | |
| Price / MAexp50: | -9.67% | |
| Price / MAexp100: | -7.17% |
News
The last news published on IMCD at the time of the generation of this analysis was as follows:
- IMCD reports EBITA of EUR 127 million in the first three months of 2024
- IMCD announces dividend proposal and Supervisory Board nominations for reappointment
- IMCD reports EBITA of EUR 515 million in 2023
- IMCD appoints Dorthe Mikkelsen as member of the Supervisory Board
- IMCD reports EBITA of EUR 400 million in the first nine months of 2023
About author
Online


Add a comment
Comments
0 comments on the analysis IMCD - Daily