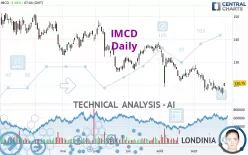
IMCD - Daily - Technical analysis published on 09/29/2023 (GMT)
- 223
- 0
Click here for a new analysis!
- Timeframe : Daily
- - Analysis generated on
- Status : TARGET REACHED

Summary of the analysis

Additional analysis
Quotes
The IMCD price is 120.75 EUR. On the day, this instrument gained +1.68% and was traded between 119.45 EUR and 120.75 EUR over the period. The price is currently at +1.09% from its lowest and 0% from its highest.The Central Gaps scanner detects a bullish opening marking the presence of buyers ahead of sellers at the opening but not sufficiently marked to allow the price to register a quotation gap.
Bullish opening
Type : Bullish
Timeframe : Openning
Opening Gap DOWN
Type : Bearish
Timeframe : Openning
Here is a more detailed summary of the historical variations registered by IMCD:
New LOW record (1st january)
Type : Bearish
Timeframe : Weekly
New LOW record (1 month)
Type : Bearish
Timeframe : Weekly
Technical
Technical analysis of IMCD in Daily shows a overall strongly bearish trend. 85.71% of the signals given by moving averages are bearish. The slightly bearish signals from short-term moving averages show that the overall trend is slowing down. The Central Indicators market scanner currently does not detect any result that concerns moving averages.
In fact, of the 18 technical indicators analysed by Central Analyzer, 6 are bullish, 3 are neutral and 9 are bearish. Caution: the Central Indicators scanner currently detects an excess:
MACD indicator: bullish divergence
Type : Bullish
Timeframe : Daily
RSI indicator: bullish divergence
Type : Bullish
Timeframe : Daily
Pivot points : price is over resistance 1
Type : Neutral
Timeframe : Daily
MACD crosses UP its Moving Average
Type : Bullish
Timeframe : Daily
The Central Patterns scanner, which studies chart patterns, resistances and supports, has identified this signal:
Near resistance of channel
Type : Bearish
Timeframe : Daily
For a small rebound in the very short term, the Central Candlesticks scanner currently notes the presence of this bullish pattern in Japanese candlesticks:
Bullish engulfing lines
Type : Bullish
Timeframe : Daily
| S3 | S2 | S1 | Price | R1 | R2 | R3 | |
|---|---|---|---|---|---|---|---|
| ProTrendLines | 97.22 | 112.44 | 118.22 | 120.75 | 126.55 | 137.95 | 147.90 |
| Change (%) | -19.49% | -6.88% | -2.10% | - | +4.80% | +14.24% | +22.48% |
| Change | -23.53 | -8.31 | -2.53 | - | +5.80 | +17.20 | +27.15 |
| Level | Intermediate | Major | Major | - | Major | Intermediate | Minor |
Pivot points can also be used to set your price objectives. Here is the price situation in relation to pivot points:
| Pivot points | S3 | S2 | S1 | PP | R1 | R2 | R3 |
|---|---|---|---|---|---|---|---|
| Standard | 113.20 | 114.35 | 116.55 | 117.70 | 119.90 | 121.05 | 123.25 |
| Camarilla | 117.83 | 118.14 | 118.44 | 118.75 | 119.06 | 119.36 | 119.67 |
| Woodie | 113.73 | 114.61 | 117.08 | 117.96 | 120.43 | 121.31 | 123.78 |
| Fibonacci | 114.35 | 115.63 | 116.42 | 117.70 | 118.98 | 119.77 | 121.05 |
| Pivot points | S3 | S2 | S1 | PP | R1 | R2 | R3 |
|---|---|---|---|---|---|---|---|
| Standard | 112.68 | 115.12 | 116.98 | 119.42 | 121.28 | 123.72 | 125.58 |
| Camarilla | 117.67 | 118.06 | 118.46 | 118.85 | 119.24 | 119.64 | 120.03 |
| Woodie | 112.40 | 114.98 | 116.70 | 119.28 | 121.00 | 123.58 | 125.30 |
| Fibonacci | 115.12 | 116.76 | 117.77 | 119.42 | 121.06 | 122.07 | 123.72 |
| Pivot points | S3 | S2 | S1 | PP | R1 | R2 | R3 |
|---|---|---|---|---|---|---|---|
| Standard | 100.23 | 109.72 | 118.48 | 127.97 | 136.73 | 146.22 | 154.98 |
| Camarilla | 122.23 | 123.90 | 125.58 | 127.25 | 128.92 | 130.60 | 132.27 |
| Woodie | 99.88 | 109.54 | 118.13 | 127.79 | 136.38 | 146.04 | 154.63 |
| Fibonacci | 109.72 | 116.69 | 121.00 | 127.97 | 134.94 | 139.25 | 146.22 |
Numerical data
The following are the details of the technical indicators and moving averages that were collected to generate this technical analysis:
| RSI (14): | 40.94 | |
| MACD (12,26,9): | -2.3000 | |
| Directional Movement: | -14.11 | |
| AROON (14): | -100.00 | |
| DEMA (21): | 117.61 | |
| Parabolic SAR (0,02-0,02-0,2): | 122.10 | |
| Elder Ray (13): | -2.38 | |
| Super Trend (3,10): | 124.34 | |
| Zig ZAG (10): | 118.75 | |
| VORTEX (21): | 0.7400 | |
| Stochastique (14,3,5): | 14.90 | |
| TEMA (21): | 117.33 | |
| Williams %R (14): | -63.69 | |
| Chande Momentum Oscillator (20): | -0.15 | |
| Repulse (5,40,3): | 1.5500 | |
| ROCnROLL: | 2 | |
| TRIX (15,9): | -0.2700 | |
| Courbe Coppock: | 8.23 |
| MA7: | 118.69 | |
| MA20: | 121.01 | |
| MA50: | 126.30 | |
| MA100: | 131.17 | |
| MAexp7: | 118.60 | |
| MAexp20: | 120.72 | |
| MAexp50: | 124.92 | |
| MAexp100: | 129.12 | |
| Price / MA7: | +1.74% | |
| Price / MA20: | -0.21% | |
| Price / MA50: | -4.39% | |
| Price / MA100: | -7.94% | |
| Price / MAexp7: | +1.81% | |
| Price / MAexp20: | +0.02% | |
| Price / MAexp50: | -3.34% | |
| Price / MAexp100: | -6.48% |
News
The latest news and videos published on IMCD at the time of the analysis were as follows:
- IMCD reports EBITA of EUR 280 million in the first half of 2023
- IMCD N.V. shareholders adopt all resolutions at AGM
- IMCD reports 6% EBITA growth in the first three months of 2023
- IMCD publishes convocation for its upcoming Annual General Meeting (Corrected)
- IMCD publishes convocation for its upcoming Annual General Meeting
About author
Online


Add a comment
Comments
0 comments on the analysis IMCD - Daily