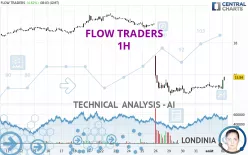
FLOW TRADERS - 1H - Technical analysis published on 08/02/2024 (GMT)
- 134
- 0
Click here for a new analysis!
- Timeframe : 1H
- - Analysis generated on
- Status : INVALID

Summary of the analysis

Additional analysis
Quotes
FLOW TRADERS rating 15.66 EUR. The price registered an increase of +3.44% on the session and was between 15.10 EUR and 15.70 EUR. This implies that the price is at +3.71% from its lowest and at -0.25% from its highest.The Central Gaps scanner detects a bearish opening. A small advantage for sellers in the very short term.
Bearish opening
Type : Bearish
Timeframe : Openning
A study of price movements over other periods shows the following variations:
New LOW record (5 years)
Type : Bearish
Timeframe : Weekly
Near a new LOW record (1 year)
Type : Bearish
Timeframe : Weekly
Near a new LOW record (1st january)
Type : Bearish
Timeframe : Weekly
Near a new LOW record (1 month)
Type : Bearish
Timeframe : Weekly
Abnormal volumes on FLOW TRADERS were detected by the Central Volumes scanner:
Abnormal volumes
Timeframe : 5 days
Technical
Technical analysis of FLOW TRADERS in 1H shows an overall bearish trend. 67.86% of the signals given by moving averages are bearish. Caution: the slightly bullish signals currently being given by short-term moving averages indicate that this bearish trend may be slowing down. The Central Indicators scanner detects bullish signals on moving averages that could impact this trend:
Bullish price crossover with Moving Average 20
Type : Bullish
Timeframe : 1 hour
Bullish price crossover with Moving Average 50
Type : Bullish
Timeframe : 1 hour
Bullish price crossover with adaptative moving average 20
Type : Bullish
Timeframe : 1 hour
Bullish price crossover with adaptative moving average 50
Type : Bullish
Timeframe : 1 hour
Bullish price crossover with adaptative moving average 100
Type : Bullish
Timeframe : 1 hour
The probability of a further increase is slight given the direction of the technical indicators.
But beware of excesses. The Central Indicators scanner currently detects this:
CCI indicator is overbought : over 100
Type : Neutral
Timeframe : 1 hour
Williams %R indicator is overbought : over -20
Type : Neutral
Timeframe : 1 hour
Pivot points : price is over resistance 1
Type : Neutral
Timeframe : 1 hour
RSI indicator is back over 50
Type : Bullish
Timeframe : 1 hour
Parabolic SAR indicator bullish reversal
Type : Bullish
Timeframe : 1 hour
Aroon indicator bullish trend
Type : Bullish
Timeframe : 1 hour
SuperTrend indicator bullish reversal
Type : Bullish
Timeframe : 1 hour
Momentum indicator is back over 0
Type : Bullish
Timeframe : 1 hour
The Central Patterns scanner, which studies chart patterns, resistances and supports, has identified these signals:
Near horizontal resistance
Type : Bearish
Timeframe : 1 hour
Resistance of channel is broken
Type : Bullish
Timeframe : 1 hour
The presence of these bullish Japanese candlestick patterns detected by Central Candlesticks that could cause a very short term rebound were also noted:
Bullish engulfing lines
Type : Bullish
Timeframe : 1 hour
Long white line
Type : Bullish
Timeframe : 1 hour
| S2 | S1 | Price | R1 | R2 | R3 | |
|---|---|---|---|---|---|---|
| ProTrendLines | 14.74 | 15.53 | 15.66 | 16.08 | 16.69 | 18.72 |
| Change (%) | -5.87% | -0.83% | - | +2.68% | +6.58% | +19.54% |
| Change | -0.92 | -0.13 | - | +0.42 | +1.03 | +3.06 |
| Level | Intermediate | Minor | - | Major | Minor | Major |
To determine price objectives, it is also possible to use the pivot points. Here is the price position in relation to pivot points:
| Pivot points | S3 | S2 | S1 | PP | R1 | R2 | R3 |
|---|---|---|---|---|---|---|---|
| Standard | 14.55 | 14.83 | 14.98 | 15.26 | 15.41 | 15.69 | 15.84 |
| Camarilla | 15.02 | 15.06 | 15.10 | 15.14 | 15.18 | 15.22 | 15.26 |
| Woodie | 14.50 | 14.80 | 14.93 | 15.23 | 15.36 | 15.66 | 15.79 |
| Fibonacci | 14.83 | 14.99 | 15.09 | 15.26 | 15.42 | 15.52 | 15.69 |
| Pivot points | S3 | S2 | S1 | PP | R1 | R2 | R3 |
|---|---|---|---|---|---|---|---|
| Standard | 8.82 | 11.96 | 13.58 | 16.72 | 18.34 | 21.48 | 23.10 |
| Camarilla | 13.88 | 14.32 | 14.75 | 15.19 | 15.63 | 16.06 | 16.50 |
| Woodie | 8.05 | 11.58 | 12.81 | 16.34 | 17.57 | 21.10 | 22.33 |
| Fibonacci | 11.96 | 13.78 | 14.91 | 16.72 | 18.54 | 19.67 | 21.48 |
| Pivot points | S3 | S2 | S1 | PP | R1 | R2 | R3 |
|---|---|---|---|---|---|---|---|
| Standard | 8.28 | 11.50 | 13.44 | 16.66 | 18.60 | 21.82 | 23.76 |
| Camarilla | 13.97 | 14.44 | 14.92 | 15.39 | 15.86 | 16.34 | 16.81 |
| Woodie | 7.65 | 11.18 | 12.81 | 16.34 | 17.97 | 21.50 | 23.13 |
| Fibonacci | 11.50 | 13.47 | 14.69 | 16.66 | 18.63 | 19.85 | 21.82 |
Numerical data
The following is the status of the technical indicators and moving averages at the time of publication of this technical analysis:
| RSI (14): | 60.61 | |
| MACD (12,26,9): | -0.0500 | |
| Directional Movement: | 10.68 | |
| AROON (14): | 21.43 | |
| DEMA (21): | 15.16 | |
| Parabolic SAR (0,02-0,02-0,2): | 15.10 | |
| Elder Ray (13): | 0.09 | |
| Super Trend (3,10): | 14.82 | |
| Zig ZAG (10): | 15.60 | |
| VORTEX (21): | 1.0400 | |
| Stochastique (14,3,5): | 45.68 | |
| TEMA (21): | 15.46 | |
| Williams %R (14): | -1.79 | |
| Chande Momentum Oscillator (20): | 0.41 | |
| Repulse (5,40,3): | 4.0000 | |
| ROCnROLL: | -1 | |
| TRIX (15,9): | -0.0900 | |
| Courbe Coppock: | 1.68 |
| MA7: | 15.82 | |
| MA20: | 17.86 | |
| MA50: | 18.61 | |
| MA100: | 18.75 | |
| MAexp7: | 15.42 | |
| MAexp20: | 15.30 | |
| MAexp50: | 15.85 | |
| MAexp100: | 16.75 | |
| Price / MA7: | -1.01% | |
| Price / MA20: | -12.32% | |
| Price / MA50: | -15.85% | |
| Price / MA100: | -16.48% | |
| Price / MAexp7: | +1.56% | |
| Price / MAexp20: | +2.35% | |
| Price / MAexp50: | -1.20% | |
| Price / MAexp100: | -6.51% |
News
The latest news and videos published on FLOW TRADERS at the time of the analysis were as follows:
- Crossover Markets Launches First-of-its-Kind Execution-Only Digital Asset Trading Venue CROSSx with Seed Round Financing from Flow Traders, Nomura's Laser Digital, Two Sigma, Wintermute Ventures, Gate.io and a Consortium of Retail Brokers
- Crossover Markets Launches First-of-its-Kind Execution-Only Digital Asset Trading Venue CROSSx with Seed Round Financing from Flow Traders, Nomura's Laser Digital, Two Sigma, Wintermute Ventures, Gate.io and a Consortium of Retail Brokers
- COMPLETION OF THE CORPORATE HOLDING STRUCTURE UPDATE
- REPURCHASE OF SHARES
- REPURCHASE OF SHARES
About author
Online


Add a comment
Comments
0 comments on the analysis FLOW TRADERS - 1H