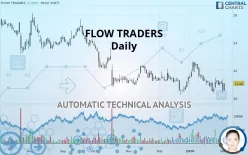
FLOW TRADERS - Daily - Technical analysis published on 02/04/2020 (GMT)
- 447
- 0
- Who voted?
Click here for a new analysis!
- Timeframe : Daily
- - Analysis generated on
- Status : TARGET REACHED

Summary of the analysis

Additional analysis
Quotes
FLOW TRADERS rating 21.06 EUR. The price is lower by +2.33% since the last closing and was between 20.54 EUR and 21.06 EUR. This implies that the price is at +2.53% from its lowest and at 0% from its highest.The Central Gaps scanner detects a bullish opening marking the presence of buyers ahead of sellers at the opening but not sufficiently marked to allow the price to register a quotation gap.
Bullish opening
Type : Bullish
Timeframe : Openning
Here is a more detailed summary of the historical variations registered by FLOW TRADERS:
Near a new LOW record (1st january)
Type : Bearish
Timeframe : Weekly
Near a new LOW record (1 month)
Type : Bearish
Timeframe : Weekly
Technical
A technical analysis in Daily of this FLOW TRADERS chart shows a sharp bearish trend. 92.86% of the signals given by moving averages are bearish. The overall trend is supported by the strong bearish signals from short-term moving averages. The Central Indicators market scanner is currently detecting a bearish signal that could impact this trend:
Moving Average bearish crossovers : MA20 & MA50
Type : Bearish
Timeframe : Daily
In fact, Central Analyzer took into account 18 technical indicators and the result was as follows: 4 are bullish, 5 are neutral and 9 are bearish. But beware of excesses. The Central Indicators scanner currently detects this:
Williams %R indicator is oversold : under -80
Type : Neutral
Timeframe : Daily
Williams %R indicator is overbought : over -20
Type : Neutral
Timeframe : Daily
Parabolic SAR indicator bullish reversal
Type : Bullish
Timeframe : Daily
Price is back under the pivot point
Type : Bearish
Timeframe : Daily
Williams %R indicator is back under -50
Type : Bearish
Timeframe : Daily
The Central Patterns scanner, which studies chart patterns, resistances and supports, has identified these signals:
Near horizontal support
Type : Bullish
Timeframe : Daily
Support of channel is broken
Type : Bearish
Timeframe : Daily
No result was found by the Central Candlesticks scanner on Japanese candlesticks.
| S3 | S2 | S1 | Price | R1 | R2 | R3 | |
|---|---|---|---|---|---|---|---|
| ProTrendLines | 17.13 | 18.72 | 20.51 | 21.06 | 21.27 | 23.60 | 25.25 |
| Change (%) | -18.66% | -11.11% | -2.61% | - | +1.00% | +12.06% | +19.90% |
| Change | -3.93 | -2.34 | -0.55 | - | +0.21 | +2.54 | +4.19 |
| Level | Intermediate | Minor | Major | - | Intermediate | Major | Major |
To determine price objectives, it is also possible to use the pivot points. Here is the price position in relation to pivot points:
| Pivot points | S3 | S2 | S1 | PP | R1 | R2 | R3 |
|---|---|---|---|---|---|---|---|
| Standard | 19.31 | 19.89 | 20.23 | 20.81 | 21.15 | 21.73 | 22.07 |
| Camarilla | 20.33 | 20.41 | 20.50 | 20.58 | 20.66 | 20.75 | 20.83 |
| Woodie | 19.20 | 19.83 | 20.12 | 20.75 | 21.04 | 21.67 | 21.96 |
| Fibonacci | 19.89 | 20.24 | 20.46 | 20.81 | 21.16 | 21.38 | 21.73 |
| Pivot points | S3 | S2 | S1 | PP | R1 | R2 | R3 |
|---|---|---|---|---|---|---|---|
| Standard | 19.92 | 20.32 | 20.68 | 21.08 | 21.44 | 21.84 | 22.20 |
| Camarilla | 20.83 | 20.90 | 20.97 | 21.04 | 21.11 | 21.18 | 21.25 |
| Woodie | 19.90 | 20.31 | 20.66 | 21.07 | 21.42 | 21.83 | 22.18 |
| Fibonacci | 20.32 | 20.61 | 20.79 | 21.08 | 21.37 | 21.55 | 21.84 |
| Pivot points | S3 | S2 | S1 | PP | R1 | R2 | R3 |
|---|---|---|---|---|---|---|---|
| Standard | 17.79 | 19.09 | 20.07 | 21.37 | 22.35 | 23.65 | 24.63 |
| Camarilla | 20.41 | 20.62 | 20.83 | 21.04 | 21.25 | 21.46 | 21.67 |
| Woodie | 17.62 | 19.01 | 19.90 | 21.29 | 22.18 | 23.57 | 24.46 |
| Fibonacci | 19.09 | 19.96 | 20.50 | 21.37 | 22.24 | 22.78 | 23.65 |
Numerical data
The following is the status of technical indicators and moving averages registered at the time this technical analysis was created:
| RSI (14): | 44.62 | |
| MACD (12,26,9): | -0.1600 | |
| Directional Movement: | -12.83 | |
| AROON (14): | -50.00 | |
| DEMA (21): | 20.91 | |
| Parabolic SAR (0,02-0,02-0,2): | 20.42 | |
| Elder Ray (13): | -0.30 | |
| Super Trend (3,10): | 21.76 | |
| Zig ZAG (10): | 20.86 | |
| VORTEX (21): | 0.8300 | |
| Stochastique (14,3,5): | 35.97 | |
| TEMA (21): | 20.82 | |
| Williams %R (14): | -57.41 | |
| Chande Momentum Oscillator (20): | -0.30 | |
| Repulse (5,40,3): | -1.4100 | |
| ROCnROLL: | 2 | |
| TRIX (15,9): | -0.0800 | |
| Courbe Coppock: | 6.28 |
| MA7: | 21.02 | |
| MA20: | 21.22 | |
| MA50: | 21.30 | |
| MA100: | 21.91 | |
| MAexp7: | 20.95 | |
| MAexp20: | 21.10 | |
| MAexp50: | 21.37 | |
| MAexp100: | 21.92 | |
| Price / MA7: | +0.19% | |
| Price / MA20: | -0.75% | |
| Price / MA50: | -1.13% | |
| Price / MA100: | -3.88% | |
| Price / MAexp7: | +0.53% | |
| Price / MAexp20: | -0.19% | |
| Price / MAexp50: | -1.45% | |
| Price / MAexp100: | -3.92% |
News
The last news published on FLOW TRADERS at the time of the generation of this analysis was as follows:
- MANAGEMENT BOARD AND SUPERVISORY BOARD UPDATE
- FLOW TRADERS 3Q19 TRADING UPDATE
- FLOW TRADERS 2Q19 NTI € 53.9M, STRATEGY REITERATED TO MAXIMIZE NTI GROWTH THROUGH SCALE AND EFFICIENCY
- Flow Traders Annual General Meeting of Shareholders adopts all proposals
- Flow Traders releases 1Q19 trading update
About author

Online


Add a comment
Comments
0 comments on the analysis FLOW TRADERS - Daily