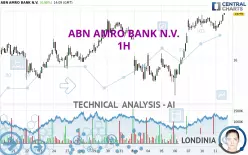
ABN AMRO BANK N.V. - 1H - Technical analysis published on 02/11/2025 (GMT)
- 107
- 0
Click here for a new analysis!
- Timeframe : 1H
- - Analysis generated on
- Status : TARGET REACHED

Summary of the analysis

Additional analysis
Quotes
ABN AMRO BANK N.V. rating 16.480 EUR. On the day, this instrument gained +0.98% and was between 16.295 EUR and 16.480 EUR. This implies that the price is at +1.14% from its lowest and at 0% from its highest.A study of price movements over other periods shows the following variations:
Near a new HIGH record (5 years)
Type : Bullish
Timeframe : Weekly
Near a new HIGH record (1 year)
Type : Bullish
Timeframe : Weekly
Near a new HIGH record (1st january)
Type : Bullish
Timeframe : Weekly
Near a new HIGH record (1 month)
Type : Bullish
Timeframe : Weekly
Technical
Technical analysis of this 1H chart of ABN AMRO BANK N.V. indicates that the overall trend is strongly bullish. 89.29% of the signals given by moving averages are bullish. This strongly bullish trend is supported by the strong bullish signals given by short-term moving averages. The Central Indicators scanner detects a bullish signal on moving averages that could impact this trend:
Moving Average bullish crossovers : MA50 & MA100
Type : Bullish
Timeframe : 1 hour
In fact, according to the parameters integrated into the Central Analyzer system, 13 technical indicators out of 18 analysed are currently bullish. Caution: the Central Indicators scanner currently detects an excess:
CCI indicator is overbought : over 100
Type : Neutral
Timeframe : 1 hour
Williams %R indicator is overbought : over -20
Type : Neutral
Timeframe : 1 hour
Pivot points : price is over resistance 1
Type : Neutral
Timeframe : 1 hour
The analysis of the price chart with Central Patterns scanners does not return any result.
No result was found by the Central Candlesticks scanner on Japanese candlesticks.
| S3 | S2 | S1 | Price | R1 | |
|---|---|---|---|---|---|
| ProTrendLines | 15.937 | 16.217 | 16.460 | 16.480 | 17.913 |
| Change (%) | -3.29% | -1.60% | -0.12% | - | +8.70% |
| Change | -0.543 | -0.263 | -0.020 | - | +1.433 |
| Level | Minor | Intermediate | Major | - | Major |
Pivot points can also be used to set your price objectives. Here is the price situation in relation to pivot points:
| Pivot points | S3 | S2 | S1 | PP | R1 | R2 | R3 |
|---|---|---|---|---|---|---|---|
| Standard | 16.133 | 16.227 | 16.273 | 16.367 | 16.413 | 16.507 | 16.553 |
| Camarilla | 16.282 | 16.294 | 16.307 | 16.320 | 16.333 | 16.346 | 16.359 |
| Woodie | 16.110 | 16.215 | 16.250 | 16.355 | 16.390 | 16.495 | 16.530 |
| Fibonacci | 16.227 | 16.280 | 16.313 | 16.367 | 16.420 | 16.453 | 16.507 |
| Pivot points | S3 | S2 | S1 | PP | R1 | R2 | R3 |
|---|---|---|---|---|---|---|---|
| Standard | 15.055 | 15.345 | 15.865 | 16.155 | 16.675 | 16.965 | 17.485 |
| Camarilla | 16.162 | 16.237 | 16.311 | 16.385 | 16.459 | 16.534 | 16.608 |
| Woodie | 15.170 | 15.403 | 15.980 | 16.213 | 16.790 | 17.023 | 17.600 |
| Fibonacci | 15.345 | 15.654 | 15.846 | 16.155 | 16.464 | 16.656 | 16.965 |
| Pivot points | S3 | S2 | S1 | PP | R1 | R2 | R3 |
|---|---|---|---|---|---|---|---|
| Standard | 13.440 | 14.075 | 15.145 | 15.780 | 16.850 | 17.485 | 18.555 |
| Camarilla | 15.746 | 15.902 | 16.059 | 16.215 | 16.371 | 16.528 | 16.684 |
| Woodie | 13.658 | 14.184 | 15.363 | 15.889 | 17.068 | 17.594 | 18.773 |
| Fibonacci | 14.075 | 14.726 | 15.129 | 15.780 | 16.431 | 16.834 | 17.485 |
Numerical data
The following are the details of the technical indicators and moving averages that were collected to generate this technical analysis:
| RSI (14): | 63.05 | |
| MACD (12,26,9): | 0.0590 | |
| Directional Movement: | 11.556 | |
| AROON (14): | -64.286 | |
| DEMA (21): | 16.428 | |
| Parabolic SAR (0,02-0,02-0,2): | 16.409 | |
| Elder Ray (13): | 0.029 | |
| Super Trend (3,10): | 16.242 | |
| Zig ZAG (10): | 16.405 | |
| VORTEX (21): | 1.0800 | |
| Stochastique (14,3,5): | 64.68 | |
| TEMA (21): | 16.420 | |
| Williams %R (14): | -24.14 | |
| Chande Momentum Oscillator (20): | 0.025 | |
| Repulse (5,40,3): | 0.2320 | |
| ROCnROLL: | 1 | |
| TRIX (15,9): | 0.0690 | |
| Courbe Coppock: | 0.13 |
| MA7: | 16.143 | |
| MA20: | 16.062 | |
| MA50: | 15.358 | |
| MA100: | 15.380 | |
| MAexp7: | 16.382 | |
| MAexp20: | 16.335 | |
| MAexp50: | 16.224 | |
| MAexp100: | 16.122 | |
| Price / MA7: | +2.09% | |
| Price / MA20: | +2.60% | |
| Price / MA50: | +7.31% | |
| Price / MA100: | +7.15% | |
| Price / MAexp7: | +0.60% | |
| Price / MAexp20: | +0.89% | |
| Price / MAexp50: | +1.58% | |
| Price / MAexp100: | +2.22% |
News
The last news published on ABN AMRO BANK N.V. at the time of the generation of this analysis was as follows:
- ABN AMRO Bank intends to propose Marguerite Bérard as new CEO
- Robert Swaak to step down as CEO of ABN AMRO in the first half of 2025
- ABN AMRO completes EUR 500 million share buyback programme of 15 February 2024
- Progress on ABN AMRO share buyback programme 26 April – 2 May 2024
- Progress on ABN AMRO share buyback programme 19 April – 25 April 2024
About author
Online


Add a comment
Comments
0 comments on the analysis ABN AMRO BANK N.V. - 1H