ABN AMRO BANK N.V. - 1H - Technical analysis published on 01/10/2025 (GMT)
- 81
- 0
Click here for a new analysis!
- Timeframe : 1H
- - Analysis generated on
- Status : TARGET REACHED
Summary of the analysis

Additional analysis
Quotes
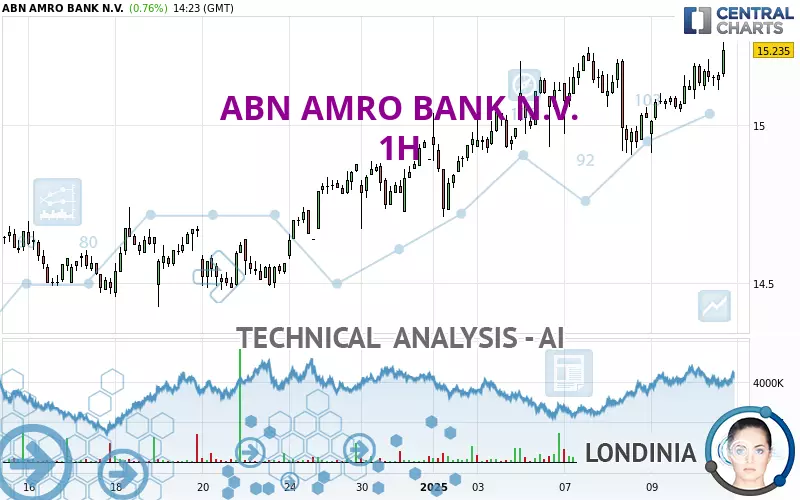
ABN AMRO BANK N.V. rating 15.235 EUR. The price registered an increase of +0.76% on the session and was traded between 15.080 EUR and 15.260 EUR over the period. The price is currently at +1.03% from its lowest and -0.16% from its highest.A bearish opening was detected by the Central Gaps scanner. Sellers are trying to impose a bearish trend in the very short term.
Bearish opening
Type : Bearish
Timeframe : Openning
Here is a more detailed summary of the historical variations registered by ABN AMRO BANK N.V.:
Near a new LOW record (1st january)
Type : Bearish
Timeframe : Weekly
Near a new LOW record (1 month)
Type : Bearish
Timeframe : Weekly
Technical
Technical analysis of ABN AMRO BANK N.V. in 1H shows a strongly overall bullish trend. 92.86% of the signals given by moving averages are bullish. The overall trend is supported by the strong bullish signals from short-term moving averages. The Central Indicators scanner does not detect any result on moving averages that would impact this trend.
An assessment of technical indicators shows a strong bullish signal.
Caution: the Central Indicators scanner currently detects an excess:
CCI indicator is overbought : over 100
Type : Neutral
Timeframe : 1 hour
Williams %R indicator is overbought : over -20
Type : Neutral
Timeframe : 1 hour
Pivot points : price is over resistance 1
Type : Neutral
Timeframe : 1 hour
Pivot points : price is over resistance 1
Type : Neutral
Timeframe : Weekly
SuperTrend indicator bullish reversal
Type : Bullish
Timeframe : 1 hour
An analysis of the price chart with the Central Patterns scanner (detector of chart patterns and resistances and supports) shows a result that can have an impact on the price change:
Near resistance of channel
Type : Bearish
Timeframe : 1 hour
The Central Candlesticks scanner which studies Japanese candlesticks did not detect anything.
| S3 | S2 | S1 | Price | R1 | R2 | R3 | |
|---|---|---|---|---|---|---|---|
| ProTrendLines | 14.906 | 15.058 | 15.135 | 15.235 | 15.245 | 15.632 | 16.090 |
| Change (%) | -2.16% | -1.16% | -0.66% | - | +0.07% | +2.61% | +5.61% |
| Change | -0.329 | -0.177 | -0.100 | - | +0.010 | +0.397 | +0.855 |
| Level | Intermediate | Intermediate | Intermediate | - | Minor | Minor | Major |
Attention could also be paid to pivot points to set price objectives:
| Pivot points | S3 | S2 | S1 | PP | R1 | R2 | R3 |
|---|---|---|---|---|---|---|---|
| Standard | 14.723 | 14.817 | 14.968 | 15.062 | 15.213 | 15.307 | 15.458 |
| Camarilla | 15.053 | 15.075 | 15.098 | 15.120 | 15.143 | 15.165 | 15.187 |
| Woodie | 14.753 | 14.831 | 14.998 | 15.076 | 15.243 | 15.321 | 15.488 |
| Fibonacci | 14.817 | 14.910 | 14.968 | 15.062 | 15.155 | 15.213 | 15.307 |
| Pivot points | S3 | S2 | S1 | PP | R1 | R2 | R3 |
|---|---|---|---|---|---|---|---|
| Standard | 14.370 | 14.520 | 14.755 | 14.905 | 15.140 | 15.290 | 15.525 |
| Camarilla | 14.884 | 14.919 | 14.955 | 14.990 | 15.025 | 15.061 | 15.096 |
| Woodie | 14.413 | 14.541 | 14.798 | 14.926 | 15.183 | 15.311 | 15.568 |
| Fibonacci | 14.520 | 14.667 | 14.758 | 14.905 | 15.052 | 15.143 | 15.290 |
| Pivot points | S3 | S2 | S1 | PP | R1 | R2 | R3 |
|---|---|---|---|---|---|---|---|
| Standard | 13.598 | 13.977 | 14.433 | 14.812 | 15.268 | 15.647 | 16.103 |
| Camarilla | 14.660 | 14.737 | 14.814 | 14.890 | 14.967 | 15.043 | 15.120 |
| Woodie | 13.638 | 13.996 | 14.473 | 14.831 | 15.308 | 15.666 | 16.143 |
| Fibonacci | 13.977 | 14.296 | 14.493 | 14.812 | 15.131 | 15.328 | 15.647 |
Numerical data
The following is the status of the technical indicators and moving averages at the time of publication of this technical analysis:
| RSI (14): | 62.67 | |
| MACD (12,26,9): | 0.0330 | |
| Directional Movement: | 10.840 | |
| AROON (14): | 100.000 | |
| DEMA (21): | 15.158 | |
| Parabolic SAR (0,02-0,02-0,2): | 15.033 | |
| Elder Ray (13): | 0.052 | |
| Super Trend (3,10): | 15.235 | |
| Zig ZAG (10): | 15.230 | |
| VORTEX (21): | 1.1730 | |
| Stochastique (14,3,5): | 84.45 | |
| TEMA (21): | 15.172 | |
| Williams %R (14): | 0.00 | |
| Chande Momentum Oscillator (20): | 0.175 | |
| Repulse (5,40,3): | 0.9430 | |
| ROCnROLL: | 1 | |
| TRIX (15,9): | 0.0190 | |
| Courbe Coppock: | 1.79 |
| MA7: | 15.077 | |
| MA20: | 14.822 | |
| MA50: | 14.910 | |
| MA100: | 15.280 | |
| MAexp7: | 15.167 | |
| MAexp20: | 15.118 | |
| MAexp50: | 15.057 | |
| MAexp100: | 14.965 | |
| Price / MA7: | +1.05% | |
| Price / MA20: | +2.79% | |
| Price / MA50: | +2.18% | |
| Price / MA100: | -0.29% | |
| Price / MAexp7: | +0.45% | |
| Price / MAexp20: | +0.77% | |
| Price / MAexp50: | +1.18% | |
| Price / MAexp100: | +1.80% |
News
The last news published on ABN AMRO BANK N.V. at the time of the generation of this analysis was as follows:
- ABN AMRO Bank intends to propose Marguerite Bérard as new CEO
- Robert Swaak to step down as CEO of ABN AMRO in the first half of 2025
- ABN AMRO completes EUR 500 million share buyback programme of 15 February 2024
- Progress on ABN AMRO share buyback programme 26 April – 2 May 2024
- Progress on ABN AMRO share buyback programme 19 April – 25 April 2024
About author
Online


Add a comment
Comments
0 comments on the analysis ABN AMRO BANK N.V. - 1H