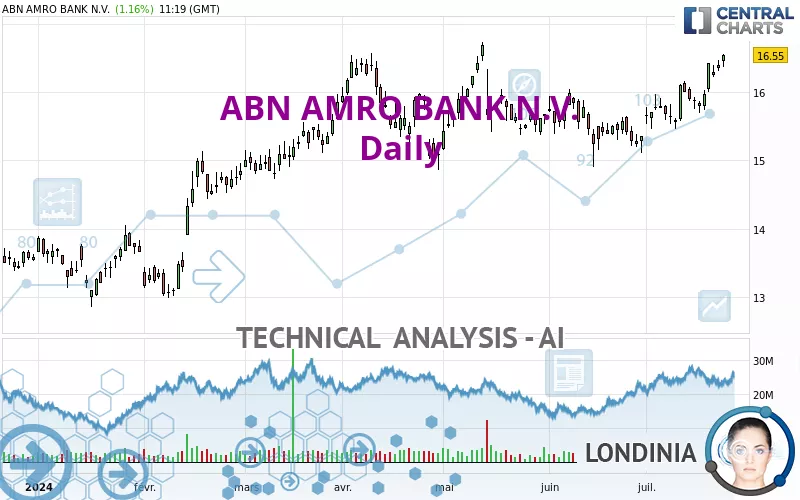
ABN AMRO BANK N.V. - Daily - Technical analysis published on 07/23/2024 (GMT)
- 155
- 0
Click here for a new analysis!
- Timeframe : Daily
- - Analysis generated on
- Status : INVALID

Summary of the analysis

Additional analysis
Quotes
The ABN AMRO BANK N.V. price is 16.550 EUR. The price has increased by +1.16% since the last closing and was traded between 16.370 EUR and 16.560 EUR over the period. The price is currently at +1.10% from its lowest and -0.06% from its highest.The Central Gaps scanner detects a bullish opening. A small advantage for buyers in the very short term.
Bullish opening
Type : Bullish
Timeframe : Openning
Here is a more detailed summary of the historical variations registered by ABN AMRO BANK N.V.:
Near a new HIGH record (5 years)
Type : Bullish
Timeframe : Weekly
Near a new HIGH record (1 year)
Type : Bullish
Timeframe : Weekly
Near a new HIGH record (1st january)
Type : Bullish
Timeframe : Weekly
New HIGH record (1 month)
Type : Bullish
Timeframe : Weekly
Technical
Technical analysis of ABN AMRO BANK N.V. in Daily shows a strongly overall bullish trend. 85.71% of the signals given by moving averages are bullish. This strongly bullish trend is supported by the strong bullish signals given by short-term moving averages. The Central Indicators scanner detects a bearish signal on moving averages that could impact this trend:
Bearish trend reversal : Moving Average 50
Type : Bearish
Timeframe : Daily
In fact, according to the parameters integrated into the Central Analyzer system, 16 technical indicators out of 18 analysed are currently bullish. But beware of excesses. The Central Indicators scanner currently detects this:
CCI indicator is overbought : over 100
Type : Neutral
Timeframe : Daily
Williams %R indicator is overbought : over -20
Type : Neutral
Timeframe : Daily
Pivot points : price is over resistance 2
Type : Neutral
Timeframe : Daily
The Central Patterns scanner, which studies chart patterns, resistances and supports, has identified this signal:
Near resistance of channel
Type : Bearish
Timeframe : Daily
The Central Candlesticks scanner which studies Japanese candlesticks did not detect anything.
| S3 | S2 | S1 | Price | R1 | R2 | |
|---|---|---|---|---|---|---|
| ProTrendLines | 13.104 | 14.503 | 15.983 | 16.550 | 16.851 | 18.641 |
| Change (%) | -20.82% | -12.37% | -3.43% | - | +1.82% | +12.63% |
| Change | -3.446 | -2.047 | -0.567 | - | +0.301 | +2.091 |
| Level | Minor | Major | Intermediate | - | Major | Major |
To determine price objectives, it is also possible to use the pivot points. Here is the price position in relation to pivot points:
| Pivot points | S3 | S2 | S1 | PP | R1 | R2 | R3 |
|---|---|---|---|---|---|---|---|
| Standard | 16.145 | 16.230 | 16.295 | 16.380 | 16.445 | 16.530 | 16.595 |
| Camarilla | 16.319 | 16.333 | 16.346 | 16.360 | 16.374 | 16.388 | 16.401 |
| Woodie | 16.135 | 16.225 | 16.285 | 16.375 | 16.435 | 16.525 | 16.585 |
| Fibonacci | 16.230 | 16.287 | 16.323 | 16.380 | 16.437 | 16.473 | 16.530 |
| Pivot points | S3 | S2 | S1 | PP | R1 | R2 | R3 |
|---|---|---|---|---|---|---|---|
| Standard | 15.085 | 15.390 | 15.820 | 16.125 | 16.555 | 16.860 | 17.290 |
| Camarilla | 16.048 | 16.115 | 16.183 | 16.250 | 16.317 | 16.385 | 16.452 |
| Woodie | 15.148 | 15.421 | 15.883 | 16.156 | 16.618 | 16.891 | 17.353 |
| Fibonacci | 15.390 | 15.671 | 15.844 | 16.125 | 16.406 | 16.579 | 16.860 |
| Pivot points | S3 | S2 | S1 | PP | R1 | R2 | R3 |
|---|---|---|---|---|---|---|---|
| Standard | 13.688 | 14.297 | 14.823 | 15.432 | 15.958 | 16.567 | 17.093 |
| Camarilla | 15.038 | 15.142 | 15.246 | 15.350 | 15.454 | 15.558 | 15.662 |
| Woodie | 13.648 | 14.276 | 14.783 | 15.411 | 15.918 | 16.546 | 17.053 |
| Fibonacci | 14.297 | 14.730 | 14.998 | 15.432 | 15.865 | 16.133 | 16.567 |
Numerical data
The following is the status of the technical indicators and moving averages at the time of publication of this technical analysis:
| RSI (14): | 66.94 | |
| MACD (12,26,9): | 0.2100 | |
| Directional Movement: | 16.162 | |
| AROON (14): | 71.429 | |
| DEMA (21): | 16.198 | |
| Parabolic SAR (0,02-0,02-0,2): | 15.789 | |
| Elder Ray (13): | 0.386 | |
| Super Trend (3,10): | 15.693 | |
| Zig ZAG (10): | 16.540 | |
| VORTEX (21): | 1.1120 | |
| Stochastique (14,3,5): | 90.06 | |
| TEMA (21): | 16.343 | |
| Williams %R (14): | -0.91 | |
| Chande Momentum Oscillator (20): | 0.870 | |
| Repulse (5,40,3): | 1.9000 | |
| ROCnROLL: | 1 | |
| TRIX (15,9): | 0.1170 | |
| Courbe Coppock: | 8.18 |
| MA7: | 16.184 | |
| MA20: | 15.849 | |
| MA50: | 15.703 | |
| MA100: | 15.319 | |
| MAexp7: | 16.245 | |
| MAexp20: | 15.958 | |
| MAexp50: | 15.682 | |
| MAexp100: | 15.207 | |
| Price / MA7: | +2.26% | |
| Price / MA20: | +4.42% | |
| Price / MA50: | +5.39% | |
| Price / MA100: | +8.04% | |
| Price / MAexp7: | +1.88% | |
| Price / MAexp20: | +3.71% | |
| Price / MAexp50: | +5.54% | |
| Price / MAexp100: | +8.83% |
News
The last news published on ABN AMRO BANK N.V. at the time of the generation of this analysis was as follows:
- ABN AMRO completes EUR 500 million share buyback programme of 15 February 2024
- Progress on ABN AMRO share buyback programme 26 April – 2 May 2024
- Progress on ABN AMRO share buyback programme 19 April – 25 April 2024
- Progress on ABN AMRO share buyback programme 12 April – 18 April 2024
- Progress on ABN AMRO share buyback programme 5 April – 11 April 2024
About author
Online


Add a comment
Comments
0 comments on the analysis ABN AMRO BANK N.V. - Daily