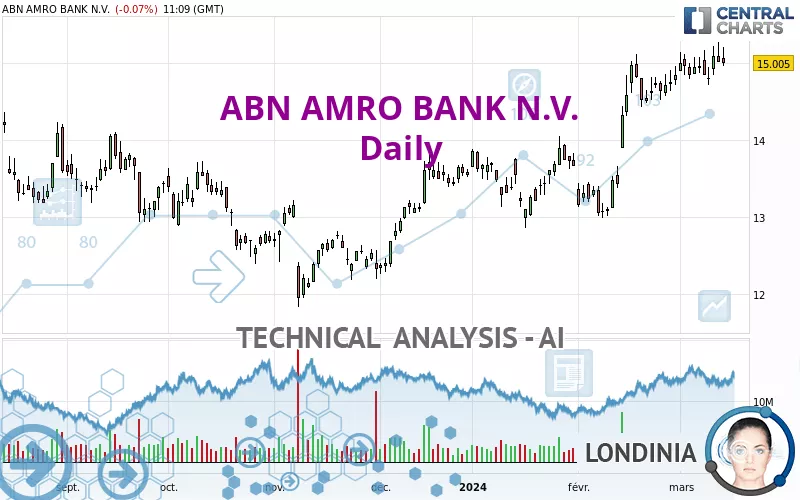
ABN AMRO BANK N.V. - Daily - Technical analysis published on 03/14/2024 (GMT)
- 132
- 0
Click here for a new analysis!
- Timeframe : Daily
- - Analysis generated on
- Status : TARGET REACHED

Summary of the analysis

Additional analysis
Quotes
The ABN AMRO BANK N.V. price is 15.005 EUR. On the day, this instrument lost -0.07% and was traded between 14.965 EUR and 15.210 EUR over the period. The price is currently at +0.27% from its lowest and -1.35% from its highest.The Central Gaps scanner detects a bullish opening. A small advantage for buyers in the very short term.
Bullish opening
Type : Bullish
Timeframe : Openning
So that you have an overall view of the price change, here is a table showing the variations over several periods:
Near a new HIGH record (5 years)
Type : Bullish
Timeframe : Weekly
Near a new HIGH record (1 year)
Type : Bullish
Timeframe : Weekly
Near a new HIGH record (1st january)
Type : Bullish
Timeframe : Weekly
Near a new HIGH record (1 month)
Type : Bullish
Timeframe : Weekly
Technical
Technical analysis of this Daily chart of ABN AMRO BANK N.V. indicates that the overall trend is strongly bullish. The signals given by the moving averages are 92.86% bullish. This strong bullish trend is confirmed by the strong signals currently being given by short-term moving averages. The Central Indicators market scanner currently does not detect any result that concerns moving averages.
The probability of a further increase are moderate given the direction of the technical indicators.
Caution: the Central Indicators scanner currently detects an excess:
CCI indicator: bearish divergence
Type : Bearish
Timeframe : Daily
Price is back over the pivot point
Type : Bullish
Timeframe : Weekly
Central Patterns, the market scanner focusing on chart patterns, resistances and supports found these results:
Near support of channel
Type : Bullish
Timeframe : Daily
Horizontal support is broken
Type : Bearish
Timeframe : Daily
The Central Candlesticks scanner, specialised in Japanese candlesticks, did not identify any signals.
| S3 | S2 | S1 | Price | R1 | R2 | R3 | |
|---|---|---|---|---|---|---|---|
| ProTrendLines | 12.875 | 13.883 | 14.995 | 15.005 | 15.365 | 17.852 | 19.748 |
| Change (%) | -14.20% | -7.48% | -0.07% | - | +2.40% | +18.97% | +31.61% |
| Change | -2.130 | -1.122 | -0.010 | - | +0.360 | +2.847 | +4.743 |
| Level | Major | Minor | Intermediate | - | Major | Minor | Major |
Attention could also be paid to pivot points to set price objectives:
| Pivot points | S3 | S2 | S1 | PP | R1 | R2 | R3 |
|---|---|---|---|---|---|---|---|
| Standard | 14.662 | 14.838 | 14.927 | 15.103 | 15.192 | 15.368 | 15.457 |
| Camarilla | 14.942 | 14.966 | 14.991 | 15.015 | 15.039 | 15.064 | 15.088 |
| Woodie | 14.618 | 14.816 | 14.883 | 15.081 | 15.148 | 15.346 | 15.413 |
| Fibonacci | 14.838 | 14.940 | 15.002 | 15.103 | 15.205 | 15.267 | 15.368 |
| Pivot points | S3 | S2 | S1 | PP | R1 | R2 | R3 |
|---|---|---|---|---|---|---|---|
| Standard | 14.337 | 14.568 | 14.707 | 14.938 | 15.077 | 15.308 | 15.447 |
| Camarilla | 14.743 | 14.777 | 14.811 | 14.845 | 14.879 | 14.913 | 14.947 |
| Woodie | 14.290 | 14.545 | 14.660 | 14.915 | 15.030 | 15.285 | 15.400 |
| Fibonacci | 14.568 | 14.710 | 14.797 | 14.938 | 15.080 | 15.167 | 15.308 |
| Pivot points | S3 | S2 | S1 | PP | R1 | R2 | R3 |
|---|---|---|---|---|---|---|---|
| Standard | 11.360 | 12.170 | 13.510 | 14.320 | 15.660 | 16.470 | 17.810 |
| Camarilla | 14.259 | 14.456 | 14.653 | 14.850 | 15.047 | 15.244 | 15.441 |
| Woodie | 11.625 | 12.303 | 13.775 | 14.453 | 15.925 | 16.603 | 18.075 |
| Fibonacci | 12.170 | 12.991 | 13.499 | 14.320 | 15.141 | 15.649 | 16.470 |
Numerical data
The following is the status of technical indicators and moving averages registered at the time this technical analysis was created:
| RSI (14): | 62.35 | |
| MACD (12,26,9): | 0.2900 | |
| Directional Movement: | 15.879 | |
| AROON (14): | 85.714 | |
| DEMA (21): | 15.114 | |
| Parabolic SAR (0,02-0,02-0,2): | 14.814 | |
| Elder Ray (13): | 0.230 | |
| Super Trend (3,10): | 14.279 | |
| Zig ZAG (10): | 14.975 | |
| VORTEX (21): | 1.1410 | |
| Stochastique (14,3,5): | 69.53 | |
| TEMA (21): | 15.149 | |
| Williams %R (14): | -38.82 | |
| Chande Momentum Oscillator (20): | 0.265 | |
| Repulse (5,40,3): | -2.3380 | |
| ROCnROLL: | 1 | |
| TRIX (15,9): | 0.3380 | |
| Courbe Coppock: | 4.43 |
| MA7: | 14.956 | |
| MA20: | 14.835 | |
| MA50: | 14.022 | |
| MA100: | 13.460 | |
| MAexp7: | 14.956 | |
| MAexp20: | 14.714 | |
| MAexp50: | 14.205 | |
| MAexp100: | 13.827 | |
| Price / MA7: | +0.33% | |
| Price / MA20: | +1.15% | |
| Price / MA50: | +7.01% | |
| Price / MA100: | +11.48% | |
| Price / MAexp7: | +0.33% | |
| Price / MAexp20: | +1.98% | |
| Price / MAexp50: | +5.63% | |
| Price / MAexp100: | +8.52% |
News
The latest news and videos published on ABN AMRO BANK N.V. at the time of the analysis were as follows:
- Progress on ABN AMRO share buyback programme 1 – 7 March 2024
- Progress on ABN AMRO share buyback programme 23 – 29 February 2024
- Progress on ABN AMRO share buyback programme 15 – 22 February 2024
- ABN AMRO announces share buyback programme of EUR 500 million
- Wouter Devriendt to step down from ABN AMRO’s Supervisory Board
About author
Online


Add a comment
Comments
0 comments on the analysis ABN AMRO BANK N.V. - Daily