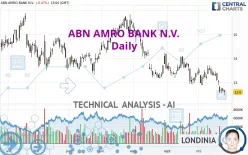
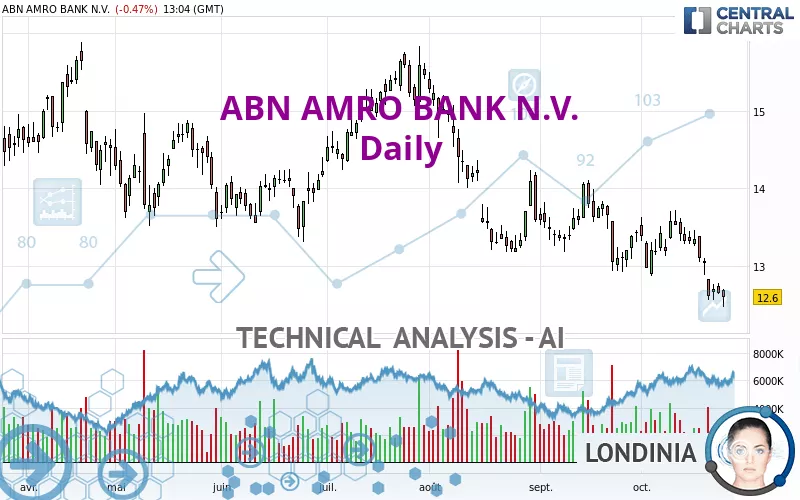
ABN AMRO BANK N.V. - Daily - Technical analysis published on 10/25/2023 (GMT)
- 198
- 0
Click here for a new analysis!
- Timeframe : Daily
- - Analysis generated on
- Status : INVALID
Summary of the analysis

Additional analysis
Quotes
The ABN AMRO BANK N.V. rating is 12.600 EUR. The price registered a decrease of -0.47% on the session and was traded between 12.475 EUR and 12.705 EUR over the period. The price is currently at +1.00% from its lowest and -0.83% from its highest.A bullish opening was detected by the Central Gaps scanner. Buyers are trying to impose a bullish momentum in the very short term.
Bullish opening
Type : Bullish
Timeframe : Openning
So that you have an overall view of the price change, here is a table showing the variations over several periods:
Near a new LOW record (1st january)
Type : Bearish
Timeframe : Weekly
New LOW record (1 month)
Type : Bearish
Timeframe : Weekly
Technical
Technical analysis of this Daily chart of ABN AMRO BANK N.V. indicates that the overall trend is strongly bearish. 92.86% of the signals given by moving averages are bearish. This strongly bearish trend is supported by the strong bearish signals given by short-term moving averages. The Central Indicators market scanner currently does not detect any result that concerns moving averages.
In fact, 13 technical indicators on 18 studied are currently bearish. Caution: the Central Indicators scanner currently detects an excess:
CCI indicator is oversold : under -100
Type : Neutral
Timeframe : Daily
Williams %R indicator is oversold : under -80
Type : Neutral
Timeframe : Daily
Pivot points : price is under support 1
Type : Neutral
Timeframe : Daily
An analysis of the price chart with the Central Patterns scanner (detector of chart patterns and resistances and supports) shows a result that can have an impact on the price change:
Near support of channel
Type : Bullish
Timeframe : Daily
The Central Candlesticks scanner which studies Japanese candlesticks did not detect anything.
| S3 | S2 | S1 | Price | R1 | R2 | R3 | |
|---|---|---|---|---|---|---|---|
| ProTrendLines | 8.115 | 8.999 | 10.797 | 12.600 | 12.869 | 13.584 | 14.197 |
| Change (%) | -35.60% | -28.58% | -14.31% | - | +2.13% | +7.81% | +12.67% |
| Change | -4.485 | -3.601 | -1.803 | - | +0.269 | +0.984 | +1.597 |
| Level | Major | Minor | Minor | - | Major | Intermediate | Intermediate |
To determine price objectives, it is also possible to use the pivot points. Here is the price position in relation to pivot points:
| Pivot points | S3 | S2 | S1 | PP | R1 | R2 | R3 |
|---|---|---|---|---|---|---|---|
| Standard | 12.453 | 12.547 | 12.603 | 12.697 | 12.753 | 12.847 | 12.903 |
| Camarilla | 12.619 | 12.633 | 12.646 | 12.660 | 12.674 | 12.688 | 12.701 |
| Woodie | 12.435 | 12.538 | 12.585 | 12.688 | 12.735 | 12.838 | 12.885 |
| Fibonacci | 12.547 | 12.604 | 12.639 | 12.697 | 12.754 | 12.789 | 12.847 |
| Pivot points | S3 | S2 | S1 | PP | R1 | R2 | R3 |
|---|---|---|---|---|---|---|---|
| Standard | 11.398 | 11.982 | 12.298 | 12.882 | 13.198 | 13.782 | 14.098 |
| Camarilla | 12.368 | 12.450 | 12.533 | 12.615 | 12.698 | 12.780 | 12.863 |
| Woodie | 11.265 | 11.915 | 12.165 | 12.815 | 13.065 | 13.715 | 13.965 |
| Fibonacci | 11.982 | 12.326 | 12.538 | 12.882 | 13.226 | 13.438 | 13.782 |
| Pivot points | S3 | S2 | S1 | PP | R1 | R2 | R3 |
|---|---|---|---|---|---|---|---|
| Standard | 11.697 | 12.313 | 12.877 | 13.493 | 14.057 | 14.673 | 15.237 |
| Camarilla | 13.116 | 13.224 | 13.332 | 13.440 | 13.548 | 13.656 | 13.765 |
| Woodie | 11.670 | 12.300 | 12.850 | 13.480 | 14.030 | 14.660 | 15.210 |
| Fibonacci | 12.313 | 12.764 | 13.043 | 13.493 | 13.944 | 14.223 | 14.673 |
Numerical data
The following is the status of technical indicators and moving averages registered at the time this technical analysis was created:
| RSI (14): | 34.40 | |
| MACD (12,26,9): | -0.2020 | |
| Directional Movement: | -17.781 | |
| AROON (14): | -71.429 | |
| DEMA (21): | 12.865 | |
| Parabolic SAR (0,02-0,02-0,2): | 13.576 | |
| Elder Ray (13): | -0.400 | |
| Super Trend (3,10): | 13.407 | |
| Zig ZAG (10): | 12.595 | |
| VORTEX (21): | 0.8540 | |
| Stochastique (14,3,5): | 10.10 | |
| TEMA (21): | 12.761 | |
| Williams %R (14): | -90.40 | |
| Chande Momentum Oscillator (20): | -0.605 | |
| Repulse (5,40,3): | -1.8550 | |
| ROCnROLL: | 2 | |
| TRIX (15,9): | -0.1320 | |
| Courbe Coppock: | 6.18 |
| MA7: | 12.869 | |
| MA20: | 13.174 | |
| MA50: | 13.359 | |
| MA100: | 13.652 | |
| MAexp7: | 12.829 | |
| MAexp20: | 13.102 | |
| MAexp50: | 13.356 | |
| MAexp100: | 13.470 | |
| Price / MA7: | -2.09% | |
| Price / MA20: | -4.36% | |
| Price / MA50: | -5.68% | |
| Price / MA100: | -7.71% | |
| Price / MAexp7: | -1.79% | |
| Price / MAexp20: | -3.83% | |
| Price / MAexp50: | -5.66% | |
| Price / MAexp100: | -6.46% |
News
Don't forget to follow the news on ABN AMRO BANK N.V.. At the time of publication of this analysis, the latest news was as follows:
- ABN AMRO discloses preliminary outcome of capital requirements for 2024
- ABN AMRO intends to appoint Ton van Nimwegen as COO and member of the Executive Board
- Tanja Cuppen not available for reappointment as ABN AMRO Chief Risk Officer
- ABN AMRO reports net profit of EUR 870 million for Q2 2023
- ABN AMRO Bank cancels repurchased shares
About author
Online


Add a comment
Comments
0 comments on the analysis ABN AMRO BANK N.V. - Daily