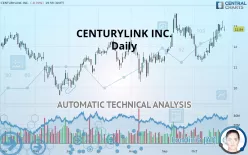
LUMEN TECHNOLOGIES INC. - Daily - Technical analysis published on 10/30/2019 (GMT)
- 406
- 0
Click here for a new analysis!
- Timeframe : Daily
- - Analysis generated on
- Status : TARGET REACHED

Summary of the analysis

Additional analysis
Quotes
The CENTURYLINK INC. rating is 12.84 USD. The price registered a decrease of -0.70% on the session and was between 12.73 USD and 12.98 USD. This implies that the price is at +0.86% from its lowest and at -1.08% from its highest.A bearish gap was detected at the opening by the Central Gaps scanner. There are a lot of sellers and they have the upper hand in the very short term.
Opening Gap DOWN
Type : Bearish
Timeframe : Openning
Here is a more detailed summary of the historical variations registered by CENTURYLINK INC.:
Near a new HIGH record (1 month)
Type : Bullish
Timeframe : Weekly
Technical
Technical analysis of CENTURYLINK INC. in Daily shows a strongly overall bullish trend. The signals given by the moving averages are 89.29% bullish. This strong bullish trend is confirmed by the strong signals currently being given by short-term moving averages. The Central Indicators scanner detects a bearish signal on moving averages that could impact this trend:
Moving Average bearish crossovers : MA20 & MA50
Type : Bearish
Timeframe : Daily
Technical indicators are strongly bullish, suggesting that the price increase should continue.
But beware of excesses. The Central Indicators scanner currently detects this:
CCI indicator is overbought : over 100
Type : Neutral
Timeframe : Daily
Williams %R indicator is overbought : over -20
Type : Neutral
Timeframe : Daily
Price is back over the pivot point
Type : Bullish
Timeframe : Weekly
Central Patterns, the market scanner focusing on chart patterns, resistances and supports found this result:
Horizontal resistance is broken
Type : Bullish
Timeframe : Daily
The Central Candlesticks scanner which studies Japanese candlesticks did not detect anything.
| S3 | S2 | S1 | Price | R1 | R2 | R3 | |
|---|---|---|---|---|---|---|---|
| ProTrendLines | 10.55 | 11.57 | 12.27 | 12.84 | 13.09 | 13.62 | 14.71 |
| Change (%) | -17.83% | -9.89% | -4.44% | - | +1.95% | +6.07% | +14.56% |
| Change | -2.29 | -1.27 | -0.57 | - | +0.25 | +0.78 | +1.87 |
| Level | Minor | Major | Major | - | Intermediate | Major | Minor |
Pivot points can also be used to set your price objectives. Here is the price situation in relation to pivot points:
| Pivot points | S3 | S2 | S1 | PP | R1 | R2 | R3 |
|---|---|---|---|---|---|---|---|
| Standard | 12.42 | 12.65 | 12.79 | 13.02 | 13.16 | 13.39 | 13.53 |
| Camarilla | 12.83 | 12.86 | 12.90 | 12.93 | 12.96 | 13.00 | 13.03 |
| Woodie | 12.38 | 12.63 | 12.75 | 13.00 | 13.12 | 13.37 | 13.49 |
| Fibonacci | 12.65 | 12.79 | 12.88 | 13.02 | 13.16 | 13.25 | 13.39 |
| Pivot points | S3 | S2 | S1 | PP | R1 | R2 | R3 |
|---|---|---|---|---|---|---|---|
| Standard | 11.48 | 11.84 | 12.37 | 12.73 | 13.26 | 13.62 | 14.15 |
| Camarilla | 12.65 | 12.73 | 12.81 | 12.89 | 12.97 | 13.05 | 13.14 |
| Woodie | 11.56 | 11.88 | 12.45 | 12.77 | 13.34 | 13.66 | 14.23 |
| Fibonacci | 11.84 | 12.18 | 12.39 | 12.73 | 13.07 | 13.28 | 13.62 |
| Pivot points | S3 | S2 | S1 | PP | R1 | R2 | R3 |
|---|---|---|---|---|---|---|---|
| Standard | 8.84 | 10.03 | 11.25 | 12.44 | 13.66 | 14.85 | 16.07 |
| Camarilla | 11.82 | 12.04 | 12.26 | 12.48 | 12.70 | 12.92 | 13.14 |
| Woodie | 8.87 | 10.04 | 11.28 | 12.45 | 13.69 | 14.86 | 16.10 |
| Fibonacci | 10.03 | 10.95 | 11.52 | 12.44 | 13.36 | 13.93 | 14.85 |
Numerical data
The following is the status of the technical indicators and moving averages at the time of publication of this technical analysis:
| RSI (14): | 60.20 | |
| MACD (12,26,9): | 0.2300 | |
| Directional Movement: | 13.28 | |
| AROON (14): | 92.86 | |
| DEMA (21): | 12.68 | |
| Parabolic SAR (0,02-0,02-0,2): | 12.43 | |
| Elder Ray (13): | 0.30 | |
| Super Trend (3,10): | 11.87 | |
| Zig ZAG (10): | 12.84 | |
| VORTEX (21): | 1.0300 | |
| Stochastique (14,3,5): | 83.01 | |
| TEMA (21): | 12.82 | |
| Williams %R (14): | -22.40 | |
| Chande Momentum Oscillator (20): | 1.11 | |
| Repulse (5,40,3): | 0.0700 | |
| ROCnROLL: | 1 | |
| TRIX (15,9): | 0.1300 | |
| Courbe Coppock: | 20.40 |
| MA7: | 12.82 | |
| MA20: | 12.12 | |
| MA50: | 12.13 | |
| MA100: | 11.68 | |
| MAexp7: | 12.75 | |
| MAexp20: | 12.43 | |
| MAexp50: | 12.13 | |
| MAexp100: | 11.95 | |
| Price / MA7: | +0.16% | |
| Price / MA20: | +5.94% | |
| Price / MA50: | +5.85% | |
| Price / MA100: | +9.93% | |
| Price / MAexp7: | +0.71% | |
| Price / MAexp20: | +3.30% | |
| Price / MAexp50: | +5.85% | |
| Price / MAexp100: | +7.45% |
News
The last news published on CENTURYLINK INC. at the time of the generation of this analysis was as follows:
- CenturyLink Expands On-Demand Network Connectivity to Google Cloud Platform
- CenturyLink named a Leader in IDC MarketScape: Worldwide Commercial CDN Vendors Report
- CenturyLink Sets Third Quarter 2019 Earnings Call Date
- CenturyLink Acquires Video Delivery Innovator Streamroot
- CenturyLink Issues Redemption Notices for Senior Notes
About author

Online


Add a comment
Comments
0 comments on the analysis LUMEN TECHNOLOGIES INC. - Daily