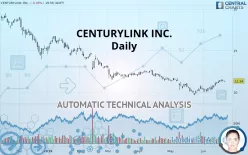
LUMEN TECHNOLOGIES INC. - Daily - Technical analysis published on 06/24/2019 (GMT)
- 392
- 0
- Who voted?
Click here for a new analysis!
- Timeframe : Daily
- - Analysis generated on
- Status : LEVEL MAINTAINED

Summary of the analysis

Additional analysis
Quotes
CENTURYLINK INC. rating 11.34 USD. The price is lower by -0.09% since the last closing and was traded between 11.25 USD and 11.41 USD over the period. The price is currently at +0.80% from its lowest and -0.61% from its highest.A study of price movements over other periods shows the following variations:
Near a new HIGH record (1 month)
Type : Bullish
Timeframe : Weekly
Technical
Technical analysis of this Daily chart of CENTURYLINK INC. indicates that the overall trend is slightly bearish. 57.14% of the signals given by moving averages are bearish. Caution: the strong bullish signals currently being given by short-term moving averages indicate that this slightly bearish trend could quickly be reversed. There is no crossing of moving average by the price or crossing of moving averages between themselves.
In fact, 12 technical indicators on 18 studied are currently positioned bullish. Caution: the Central Indicators scanner currently detects an excess:
CCI indicator is overbought : over 100
Type : Neutral
Timeframe : Daily
Williams %R indicator is overbought : over -20
Type : Neutral
Timeframe : Daily
Ichimoku : price is over the cloud
Type : Bullish
Timeframe : Daily
Price is back over the pivot point
Type : Bullish
Timeframe : Weekly
Price is back under the pivot point
Type : Bearish
Timeframe : Daily
The analysis of the price chart with Central Patterns scanners does not return any result.
The Central Candlesticks scanner, specialised in Japanese candlesticks, did not identify any signals.
| S2 | S1 | Price | R1 | R2 | R3 | |
|---|---|---|---|---|---|---|
| ProTrendLines | 9.66 | 10.70 | 11.34 | 13.62 | 16.72 | 19.13 |
| Change (%) | -14.81% | -5.64% | - | +20.11% | +47.44% | +68.69% |
| Change | -1.68 | -0.64 | - | +2.28 | +5.38 | +7.79 |
| Level | Major | Minor | - | Major | Minor | Intermediate |
To determine price objectives, it is also possible to use the pivot points. Here is the price position in relation to pivot points:
| Pivot points | S3 | S2 | S1 | PP | R1 | R2 | R3 |
|---|---|---|---|---|---|---|---|
| Standard | 10.99 | 11.14 | 11.24 | 11.39 | 11.49 | 11.64 | 11.74 |
| Camarilla | 11.28 | 11.30 | 11.33 | 11.35 | 11.37 | 11.40 | 11.42 |
| Woodie | 10.98 | 11.13 | 11.23 | 11.38 | 11.48 | 11.63 | 11.73 |
| Fibonacci | 11.14 | 11.23 | 11.29 | 11.39 | 11.48 | 11.54 | 11.64 |
| Pivot points | S3 | S2 | S1 | PP | R1 | R2 | R3 |
|---|---|---|---|---|---|---|---|
| Standard | 9.62 | 9.95 | 10.53 | 10.86 | 11.44 | 11.77 | 12.35 |
| Camarilla | 10.85 | 10.93 | 11.02 | 11.10 | 11.18 | 11.27 | 11.35 |
| Woodie | 9.73 | 10.01 | 10.65 | 10.92 | 11.56 | 11.83 | 12.47 |
| Fibonacci | 9.95 | 10.30 | 10.52 | 10.86 | 11.21 | 11.43 | 11.77 |
Numerical data
The following are the details of the technical indicators and moving averages that were collected to generate this technical analysis:
| RSI (14): | 61.66 | |
| MACD (12,26,9): | 0.1900 | |
| Directional Movement: | 11.78 | |
| AROON (14): | 71.42 | |
| DEMA (21): | 11.04 | |
| Parabolic SAR (0,02-0,02-0,2): | 10.77 | |
| Elder Ray (13): | 0.32 | |
| Super Trend (3,10): | 10.43 | |
| Zig ZAG (10): | 11.34 | |
| VORTEX (21): | 1.1900 | |
| Stochastique (14,3,5): | 85.53 | |
| TEMA (21): | 11.40 | |
| Williams %R (14): | -14.47 | |
| Chande Momentum Oscillator (20): | 1.17 | |
| Repulse (5,40,3): | -0.1800 | |
| ROCnROLL: | 1 | |
| TRIX (15,9): | 0.0700 | |
| Courbe Coppock: | 20.11 |
| MA7: | 11.28 | |
| MA20: | 10.67 | |
| MA50: | 10.89 | |
| MA100: | 11.71 | |
| MAexp7: | 11.21 | |
| MAexp20: | 10.88 | |
| MAexp50: | 11.05 | |
| MAexp100: | 11.98 | |
| Price / MA7: | +0.53% | |
| Price / MA20: | +6.28% | |
| Price / MA50: | +4.13% | |
| Price / MA100: | -3.16% | |
| Price / MAexp7: | +1.16% | |
| Price / MAexp20: | +4.23% | |
| Price / MAexp50: | +2.62% | |
| Price / MAexp100: | -5.34% |
News
The latest news and videos published on CENTURYLINK INC. at the time of the analysis were as follows:
- CenturyLink Makes Major Investment in New Miami Network Gateway
- CenturyLink Announces Expiration of Tender Offers and Consent Solicitations
- CenturyLink Announces Successful Early Tender Results
- CenturyLink to present at the Cowen and Company 47th Annual Technology, Media & Telecom Conference
- CenturyLink Declares Quarterly Cash Dividend
About author

Online


Add a comment
Comments
0 comments on the analysis LUMEN TECHNOLOGIES INC. - Daily