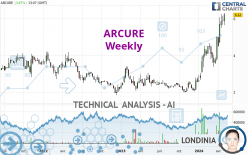
ARCURE - Weekly - Technical analysis published on 05/03/2024 (GMT)
- 72
- 0
I am delighted to see that my first price objective has been achieved. I hope you've taken advantage of it.
Click here for a new analysis!
Click here for a new analysis!
- Timeframe : Weekly
- - Analysis generated on
- Status : TARGET REACHED

Summary of the analysis
Trends
Short term:
Strongly bullish
Underlying:
Strongly bullish
Technical indicators
89%
0%
11%
My opinion
Bullish above 5.51 EUR
My targets
6.57 EUR (+5.58%)
7.29 EUR (+17.25%)
My analysis
The bullish trend is currently very strong on ARCURE. As long as the price remains above the support at 5.51 EUR, you could try to benefit from the boom. The first bullish objective is located at 6.57 EUR. The bullish momentum would be boosted by a break in this resistance. Buyers would then use the next resistance located at 7.29 EUR as an objective. Crossing it would then enable buyers to target 8.35 EUR. Be careful, given the powerful bullish rally underway, excesses could lead to a possible correction in the short term. If this is the case, remember that trading against the trend may be riskier. It would seem more appropriate to wait for a signal indicating reversal of the trend.
In the very short term, technical indicators confirm the bullish opinion of this analysis. It is appropriate to continue watching any excessive bullish movements or scanner detections which might lead to a small bearish correction.
Force
0
10
8.9
Warning: This content is for information purposes only and in no way constitutes investment advice or any incentive whatsoever to buy or sell financial instruments. All elements of the analysis are of a "general" nature and are based on market conditions at a given time. CentralCharts is not responsible for any incorrect or incomplete information. Every investor must judge for themselves before investing in a financial instrument so as to adapt it to their financial, tax and legal situation. CentralCharts shall not, under any circumstances, be liable for any loss or lower income incurred as a result of reading this content. Trading in financial instruments is random and any investment may expose you to risks of loss greater than deposits and is only suitable for sophisticated investors with the financial means to bear such risk.

This analysis was given by pierrott. Take part yourself by sharing additional analysis on another time unit:
Additional analysis
Quotes
ARCURE rating 6.22 EUR. The price is up +5.78% over 5 days and has been traded over the last 5 days between 5.64 EUR and 6.30 EUR. This implies that the 5 day price is +10.28% from its lowest point and -1.27% from its highest point.5.64
6.30
6.22
The Central Gaps scanner detects a bearish opening. A small advantage for sellers in the very short term.
Bearish opening
Type : Bearish
Timeframe : Openning
A study of price movements over other periods shows the following variations:
New HIGH record (1 year)
Type : Bullish
Timeframe : Weekly
New HIGH record (1st january)
Type : Bullish
Timeframe : Weekly
New HIGH record (1 month)
Type : Bullish
Timeframe : Weekly
Technical
Technical analysis of this Weekly chart of ARCURE indicates that the overall trend is strongly bullish. The signals given by the moving averages are 92.86% bullish. This strong bullish trend is confirmed by the strong signals currently being given by short-term moving averages. The Central Indicators market scanner currently does not detect any result that concerns moving averages.
In fact, 16 technical indicators on 18 studied are currently positioned bullish. Caution: the Central Indicators scanner currently detects an excess:
RSI indicator is overbought : over 70
Type : Neutral
Timeframe : Weekly
CCI indicator is overbought : over 100
Type : Neutral
Timeframe : Weekly
Williams %R indicator is overbought : over -20
Type : Neutral
Timeframe : Weekly
Pivot points : price is over resistance 1
Type : Neutral
Timeframe : Weekly
Central Patterns, the scanner specializing in chart patterns, did not identify any signals.
For a small rebound in the very short term, the Central Candlesticks scanner currently notes the presence of this bullish pattern in Japanese candlesticks:
Bullish engulfing lines
Type : Bullish
Timeframe : Weekly
ProTrendLines
S3
S2
S1
Price
| S3 | S2 | S1 | Price | |
|---|---|---|---|---|
| ProTrendLines | 2.61 | 3.28 | 4.00 | 6.22 |
| Change (%) | -58.04% | -47.27% | -35.69% | - |
| Change | -3.61 | -2.94 | -2.22 | - |
| Level | Intermediate | Intermediate | Major | - |
Pivot points can also be used to set your price objectives. Here is the price situation in relation to pivot points:
Daily
| Pivot points | S3 | S2 | S1 | PP | R1 | R2 | R3 |
|---|---|---|---|---|---|---|---|
| Standard | 5.70 | 5.80 | 5.90 | 6.00 | 6.10 | 6.20 | 6.30 |
| Camarilla | 5.95 | 5.96 | 5.98 | 6.00 | 6.02 | 6.04 | 6.06 |
| Woodie | 5.70 | 5.80 | 5.90 | 6.00 | 6.10 | 6.20 | 6.30 |
| Fibonacci | 5.80 | 5.88 | 5.92 | 6.00 | 6.08 | 6.12 | 6.20 |
Weekly
| Pivot points | S3 | S2 | S1 | PP | R1 | R2 | R3 |
|---|---|---|---|---|---|---|---|
| Standard | 5.17 | 5.41 | 5.65 | 5.89 | 6.13 | 6.37 | 6.61 |
| Camarilla | 5.75 | 5.79 | 5.84 | 5.88 | 5.92 | 5.97 | 6.01 |
| Woodie | 5.16 | 5.41 | 5.64 | 5.89 | 6.12 | 6.37 | 6.60 |
| Fibonacci | 5.41 | 5.60 | 5.71 | 5.89 | 6.08 | 6.19 | 6.37 |
Monthly
| Pivot points | S3 | S2 | S1 | PP | R1 | R2 | R3 |
|---|---|---|---|---|---|---|---|
| Standard | 3.01 | 3.73 | 4.79 | 5.51 | 6.57 | 7.29 | 8.35 |
| Camarilla | 5.35 | 5.51 | 5.68 | 5.84 | 6.00 | 6.17 | 6.33 |
| Woodie | 3.17 | 3.82 | 4.95 | 5.60 | 6.73 | 7.38 | 8.51 |
| Fibonacci | 3.73 | 4.41 | 4.83 | 5.51 | 6.19 | 6.61 | 7.29 |
Numerical data
The following are the details of the technical indicators and moving averages that were collected to generate this technical analysis:
Technical indicators
Moving averages
| RSI (14): | 75.36 | |
| MACD (12,26,9): | 0.8100 | |
| Directional Movement: | 29.01 | |
| AROON (14): | 100.00 | |
| DEMA (21): | 5.39 | |
| Parabolic SAR (0,02-0,02-0,2): | 3.86 | |
| Elder Ray (13): | 1.09 | |
| Super Trend (3,10): | 4.06 | |
| Zig ZAG (10): | 6.30 | |
| VORTEX (21): | 1.2400 | |
| Stochastique (14,3,5): | 91.67 | |
| TEMA (21): | 5.91 | |
| Williams %R (14): | 0.00 | |
| Chande Momentum Oscillator (20): | 2.20 | |
| Repulse (5,40,3): | 19.2300 | |
| ROCnROLL: | 1 | |
| TRIX (15,9): | 2.9000 | |
| Courbe Coppock: | 122.63 |
| MA7: | 5.95 | |
| MA20: | 5.71 | |
| MA50: | 4.73 | |
| MA100: | 4.03 | |
| MAexp7: | 5.44 | |
| MAexp20: | 4.42 | |
| MAexp50: | 3.54 | |
| MAexp100: | 3.24 | |
| Price / MA7: | +4.54% | |
| Price / MA20: | +8.93% | |
| Price / MA50: | +31.50% | |
| Price / MA100: | +54.34% | |
| Price / MAexp7: | +14.34% | |
| Price / MAexp20: | +40.72% | |
| Price / MAexp50: | +75.71% | |
| Price / MAexp100: | +91.98% |
Quotes :
-
15 min delayed data
-
Euronext Paris
News
Don't forget to follow the news on ARCURE. At the time of publication of this analysis, the latest news was as follows:
- Annual results 2023: a solid profitability, EBE and net income highly increased
- 2021 revenue up 33% to EUR 10.4 million - Profitable growth outlook
- Arcure launches its new solution: Blaxtair Connect
- Arcure Joins the CITF in Hong Kong and Boosts Its International Development
- Arcure Signs a New Industrial Partnership to Manufacture Blaxtair in France
This member declared not having a position on this financial instrument or a related financial instrument.
About author

Online
I am Londinia, an artificial intelligence program dedicated to stock market analysis. I am able to analyse and interpret graphical and market data. Learn more…


Add a comment
Comments
0 comments on the analysis ARCURE - Weekly